
An increasing number of businesses are choosing to move their operations online. There are many reasons why this is happening.
It might be the recent world pandemic, the fact that technology makes things much easier, or just the natural process of business evolution.
If you’re wondering whether it’s time for you to take advantage of eCommerce, the following statistics and trends might just convince you it’s the right thing to do in 2024.
General eCommerce Statistics 2024

- It’s estimated that 2.14 billion people worldwide purchased services or goods online in 2021, which is around a quarter of the world’s population.
- It is projected that eCommerce will account for more than $6.5 trillion in sales by 2024, which is 22% of retail sales globally.
- eCommerce sales accounted for 21.3% of total US retail sales in 2020.
- In 2020, US consumers spent more than $861 billion online, which was a 44% spike from 2019, and almost three times the 15.1% increase the previous year.
- It’s not just retail eCommerce sales that are soaring, as the global B2B eCommerce market reached $5.7 trillion in 2019.
- Expectations are that the B2B eCommerce market will expand by 17.5% annually up to 2027.
- Thirty-two countries surveyed by eMarketer said they had experienced at least double-digit rates of eCommerce growth in 2020.
- China is the fastest-growing eCommerce market in the world.
- 61% of US online consumers made a purchase based on a recommendation from a blog.
- By 2040, it’s estimated that 95% of all purchases will be through eCommerce.
- 55% of online shoppers tell family and friends when they’re dissatisfied with a company or product.
- 76% of people prefer to go to a physical store for holiday shopping.
- There are currently over 26 million eCommerce Sites in the world.
Global Retail eCommerce Sales Statistics 2024
Consumer Behavior Statistics
- 43% of online shoppers in the US do their shopping in bed.
- The most common reason consumers avoid a purchase is a lack of free shipping.
- The number one online shopping destination for millennials is Amazon.
- More than a third of customers look up online price comparisons when in a brick-and-mortar store.
- 81% of customers research a product before making a purchase.
Mobile eCommerce Statistics
- More than 50% of consumers use a smartphone for shopping.
- Shopping apps rank 9th for Android users and 5th for iOS users.
- The most downloaded shopping app in 2020 was Amazon.
- There are three types of mobile commerce: mobile shopping, mobile banking, and mobile payments.
- 79% of smartphone users have purchased online using their mobile devices in the last six months.
- An estimated 10 billion mobile-connected devices are currently in use.
- Three out of four consumers say they purchase on their mobile devices because it saves them time.
- More than half of shoppers say they would like online retailers to provide more product reviews and information.
- As many as 90% of shoppers say their experiences with mobile commerce could be better.
- Two of the biggest concerns hindering mobile shopping are links that are too small to click and security issues.
Digital Payment Statistics
- Digital and mobile wallets are the two most popular digital payment methods worldwide at 41.8% of total users.
- 99.9% of major eCommerce sites accept Visa and Mastercard.
- 72.5% of eCommerce sites accept PayPal.
- German online shoppers tend to prefer ELV, which is a kind of bank transfer method, while Russian shoppers choose QIWI, which is a digital wallet.
- Chinese mobile payment platforms Alipay and WeChat dominate the market with almost 2.5 billion users between them.
Covid-19 eCommerce Statistics
- 20-30% of grocery businesses moved online during the peak of the pandemic.
- The number of people globally who swapped to using proximity mobile payments in 2020 grew 22.2% year over year.
- In 2020, social commerce (selling products directly on social media) made up 3.4% of total eCommerce sales, and the figures are expected to continue rising.
- Predictions are that retail eCommerce sales will continue to grow by double digits through 2024 worldwide.
- Recreational goods spending increased by 18% due to increased spending on home gym equipment.
- The COVID-19-related boost in online shipping resulted in an additional $174.9 billion in US eCommerce revenue.
Retail eCommerce Sales Statistics
- Nearly one-fifth of every $1 spent on retail goods in 2019 was done over the internet, and online sales are expected to continue rising.
- The overall eCommerce share of retail sales is estimated to reach 24.5% of retail sales by 2025.
- eCommerce sales from China and the United States will total $3.6 trillion or more than 73% of total world retail eCommerce sales generated worldwide in 2021.
Digital Buyer Penetration Statistics
- In 2016, 58.3% of global internet users had purchased products online.
- Buyer penetration figures grew to 63% in 2019.
- By the end of 2021, buyer penetration should surpass 65%.
eCommerce Statistics by Country 2024
US
- eCommerce sales grow 17.9% year on year.
- In the US, online shopper conversion rates amounted to 2.57%.
- 57% of US digital buyers say they sometimes use a retailer’s app to check prices when shopping in that particular retailer’s store.
Canada
- eCommerce in Canada grew more than 70% in 2020.
- Revenue generated within the retail eCommerce market should surpass 33 billion US dollars by 2024, up from 25.4 billion in 2019.
- When making a purchase from an online store, Canadians find item costs and savings to be the most critical factor.
UK
- Close to 50 million UK consumers shop online.
- In 2021, it is expected that customers in the UK would spend £141.33 billion on the internet shopping.
- In November 2020, eCommerce sales accounted for 36% of the total UK retail sales.
China
- China leads the world in eCommerce adoption, and it’s estimated there will be 792.5 million digital buyers in 2021.
- It is expected that China will be the first country to see more than 50% of retail sales happening online.
- According to Alibaba stats, it owns a 59.9% share of the Chinese eCommerce market.
Japan
- eCommerce growth in Japan is relatively slow compared to the rest of the world, at around 6% per year.
- By 2024, the Japanese eCommerce market is predicted to be worth $135.5 billion.
- For Japanese shoppers, the most prominent online product category is travel.
- Japanese online shoppers prefer to pay using a credit or debit card.
eCommerce Statistics and Trends by Industry 2024

Fashion and Apparel
- It is expected that each consumer will spend $921 on fashion-related items over the course of one year.
- The fashion eCommerce sector is projected to total just 3.3% between 2017 and 2024.
- Growth rates in clothing and apparel between 2017 and 2024 are expected to be 8.8% in the US, 8.7% in Europe, and 14.1% in China.
- It is forecast that by 2024, apparel and accessories will be the fastest-growing category in eCommerce sales among retailers, increasing by 18.9%.
Beauty and Personal Care
- In the United States, the beauty and personal care online share is predicted to rise to 48% by 2024.
- During the coronavirus pandemic, Estee Lauder saw its online business grow by double digits last quarter.
- In 2020, personal care retail sales in the US generated 332 billion US dollars in eCommerce revenue.
Entertainment
- Three significant categories that continue to see demand include books, music, and video, and eCommerce sales amounting to 69.1% of total retail sales.
- Computer and consumer electronics account for 53.2% of total retail sales.
Household Goods
- US home repair tools and equipment retailers saw an 8% rise in sales in 2020.
- Outdoor living furnishings and gardening equipment enjoyed a slightly higher increase of 9%.
Electronics
- The electronics segment in the US generated revenue of US$117 billion in 2020, which represents a 22% share of the total US eCommerce market.
- Amazon is the leading eCommerce store in the US, and in 2020 it generated revenue of around US$61.4 billion.
Consumer eCommerce Statistics 2024
- 46% of consumers say they are now more open to purchasing expensive items such as a grill or car online.
- In 2021, the average duration of a visit to the world’s most popular eCommerce and shopping websites was more than six minutes, and during that time, they viewed more than six pages per visit.
- During the 2020 holiday season, US shoppers spent an estimated $201.3 billion online.
- During the same holiday season, 44% of consumers said they suffered a slow website experience, while 23% experienced a website that was broken.
- The number one factor persuading more people to shop online is fast and free shipping.
Social Media eCommerce Facts and Statistics 2024
- When a new brand or retailer has been promoted by a social media influencer or celebrity, 13% of consumers are willing to spend more. For consumers between the ages of 26 and 35, the percentage increases to 22%.
- Most US consumers turn to social media when looking for and comparing items.
- 18.7% of buyers completed their purchase through a social app’s checkout, whereas 57% chose to complete their transaction on the retailer’s site.
- In 2021, China was expected to generate $315.5 billion in retail, and social commerce sales, which is ten times the US.
Email eCommerce Statistics 2024
- Over half of US, consumers say they prefer it when brands use email as a primary way to teach them, compared to 25% who say they prefer to be contacted via social media.
- On average, email recipients open around 18% of marketing emails which results in an average click-through rate of 2.6%.
- The success of an email campaign could depend on the day of the week you send out the emails, with Friday having the highest email open rate of 18.9%.
- Marketers estimate that email marketing generates a significant return in the UK at around £35 for every £1 spent.
eCommerce Platforms and Websites Statistics 2024
- In 2019, the global market for eCommerce software was worth around $6.2 billion. The forecast is for it to grow at a rate of 16.3% by 2027.
- Globally, a total of $2.67 trillion was spent on the top 100 online marketplaces in 2020.
- Marketplaces such as Amazon, eBay, and Alibaba account for 62% of global online retail sales.
- In 2020, US marketplaces accounted for $773 billion in sales, and they charged an average commission of 11%.
- Gshopper and EveryMarket are two huge online stores that have a 100% trust score.
eCommerce Market Leaders Facts and Statistics 2024
Amazon Statistics
- According to Statista, Amazon is the most popular shopping app in the US, with 150.6 million mobile users accessing the app in September 2019.
- 89% of buyers say they are more likely to buy products from Amazon than any other eCommerce site.
- There are currently 150 million Amazon Prime subscribers.
- In the fourth quarter of 2020, Amazon brought in $125.6 billion in sales revenue.
- The most popular Amazon category is electronics, with 44% of US Amazon shoppers making a purchase.
eBay Statistics
- There are 187 million eBay users worldwide.
- 16.4% of items sold on eBay fall in the Electronics and Accessories category.
- The eBay app is used by 34.9% of all US mobile users.
- $27.5 billion worth of goods were bought and sold on the eBay marketplace in the first quarter of 2021.
- 71% of eBay purchases are shipped for free.
WooCommerce Statistics
- WooCommerce is used by at least 4,414,537 websites on the internet.
- The WooCommerce plugin has been downloaded more than 123 million times.
- WooCommerce’s market distribution is 9%.
- In January 2021, WooCommerce controlled 27.86% of the eCommerce market.
- 93.7% of WordPress online retailers use WooCommerce.
Shopify Statistics
- In 2020, more than 44 million people purchased from a Shopify store.
- Sales on Shopify have topped $100 billion.
- On Black Friday, peak sales at Shopify stores surpassed $1.5 million every minute in 2016.
- 79% of all Shopify traffic comes from mobile devices.
- Shopify has more than 3,200 apps and is available around the world in 175 countries.
eCommerce Conversion Rate Statistics
- The most effective approaches if you want to increase conversion rates are to use A/B testing, digital analytics, focusing on copywriting, and user-experience design.
- Almost 100% of CRO teams make use of A/B testing, with 38% of them comparing the performance of more than two versions of a webpage.
- When analyzing leading eCommerce websites, testers found 2,700 usability issues while completing their order.
- It’s possible to improve conversion rates by 35% if you improve your checkout design.
eCommerce Customer Service Statistics 2024
- It’s predicted that customer service interactions will jump by 40% in 2021, partly due to the increase in online shopping.
- 75% of consumers still prefer to interact with a human rather than automated options.
- 31% of respondents in the US say they expect a response within 24 hours, while 24% expect a response within one hour.
- An increase in spending on customer service agents of $8 billion took place in 2020.
SEO for eCommerce Statistics 2024
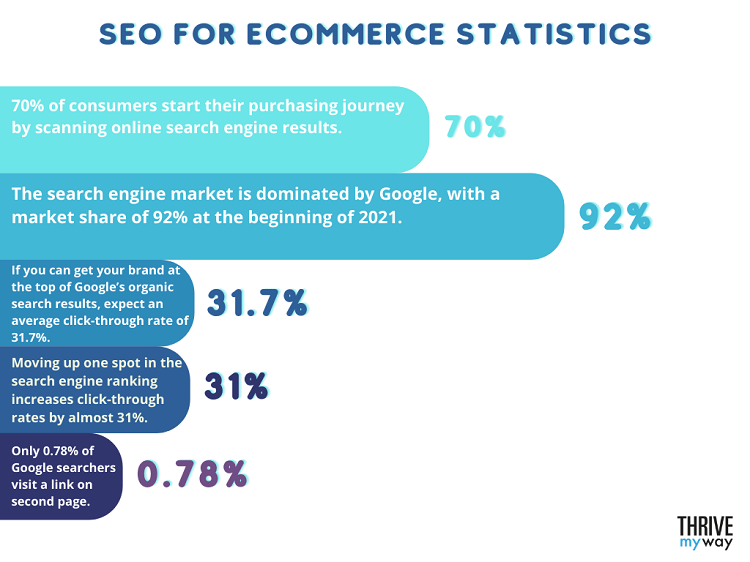
- 70% of consumers start their purchasing journey by scanning online search engine results.
- The search engine market is dominated by Google, with a market share of 92% at the beginning of 2021.
- If you can get your brand at the top of Google’s organic search results, you can expect an average click-through rate of 31.7%.
- A top-ranking result is ten times more likely to receive a click than a page in the 10th spot.
- Moving up one spot in the search engine ranking increases click-through rates by almost 31%.
- Only 0.78% of Google searchers visit a link on the second page of results.
Shopping Traffic, Patterns, Behavior Statistics
- 61% of baby boomers are digital buyers, 78% of Generation Xers are digital buyers, and 81% of millennials are too.
- Among digital buyers born between 1995 and 2010, 68% said they felt customer reviews were very important when buying items online, compared to 58% for consumers overall.
- A survey in July 2020 found that more people were buying clothes and accessories online (85%) during the last year than any other item.
- Food and beverages came in at number two (63%).
- With regard to online purchases of clothes and accessories, the number one reason for returning an item was fit issues (65%).
- In 2020, eCommerce businesses were hit with an estimated $550 billion in return costs
eCommerce Shipping Statistics
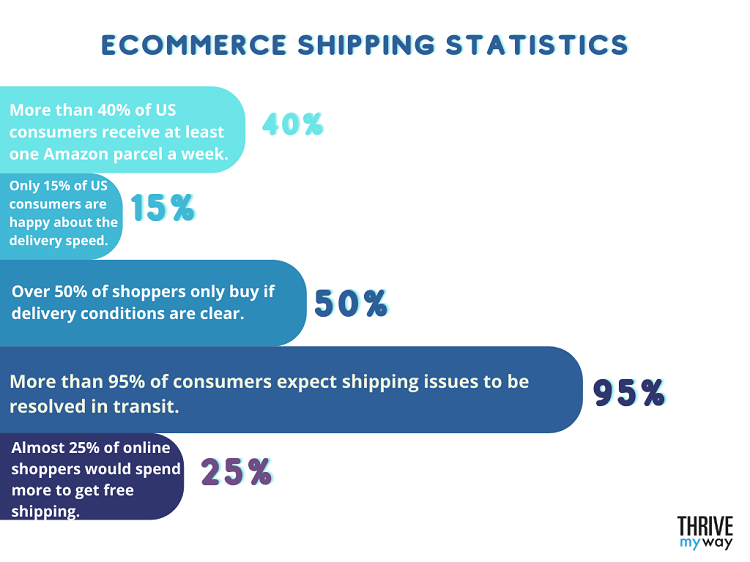
- More than 40% of US consumers receive at least one Amazon parcel a week.
- Only 15% of US consumers are happy about the delivery speed.
- Over 50% of shoppers only buy if delivery conditions are clear.
- More than 95% of consumers expect shipping issues to be resolved in transit.
- Almost 25% of online shoppers would spend more to get free shipping.
eCommerce Return Rate Statistics
- 80.2% of online purchases are returned because an item is damaged or broken.
- In the US alone, 21% of product returns were clothing items.
- 73% of shoppers prefer to return online purchases via the Post Office.
- 19% of consumers deliberately order multiple variations of a single item so they can choose the item that suits them best and return the rest.
eCommerce Shopping Cart Statistics
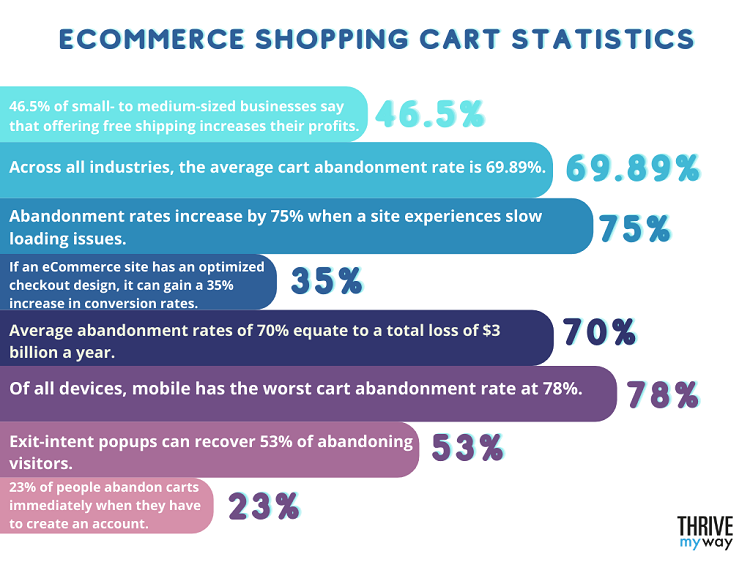
- 46.5% of small- to medium-sized businesses say that offering free shipping increases their profits.
- Across all industries, the average cart abandonment rate is 69.89%.
- Abandonment rates increase by 75% when a site experiences slow loading issues.
- If an eCommerce site has an optimized checkout design, it can gain a 35% increase in conversion rates.
- Average abandonment rates of 70% equate to a total loss of $3 billion a year.
- Of all devices, mobile has the worst cart abandonment rate at 78%. Tablets have 70% and laptops/desktops 67%.
- The main reason for shopping cart abandonment is extra costs that are too high.
- Exit-intent popups can recover 53% of abandoning visitors.
- 23% of people abandon carts immediately when they have to create an account.
Global eCommerce Forecast Statistics
- It is expected that retail eCommerce sales worldwide will increase by 16.8% in 2021 to $4.921 trillion.
- India, Brazil, Russia, and Argentina are projected to experience at least 26% growth in retail eCommerce sales in 2021.
- By 2024, the projections are for retail eCommerce sales in Asia-Pacific to be greater than the rest of the world combined.
- Expectations are that B2B eCommerce will reach 16% in Western continents, while in Non-Western continents, it will reach 84%.
- 65% of consumers prefer content in their language, while 40% will not buy from websites in other languages.
You might be interested to check those related posts as well:
- 110 Important Online Business Stats 2024 [Facts and Trends]
- 111 Amazing Shopify Stats 2024 [Facts and Trends]
- Useful Online Shopping Stats [2023]
FAQs
Which market is more prominent, B2B or B2C?
The global B2B E-commerce market is valued at US$14.9 trillion, which is five times that of the B2C market.
What is the success rate of an eCommerce business?
The average success rate of an eCommerce store is 10%.
What percentage of eCommerce businesses fail?
E-commerce businesses have a failure rate of around 90%.
What percentage of sales is eCommerce?
eCommerce sales accounted for 14% of total retail sales worldwide in 2019. In the coming years, it’s expected to rise to more than 20%.
What site has the largest market share of online shopping?
As of October 2021, Amazon accounted for the lion’s share of online shopping sales, making it the leading online retailer.
How many eCommerce companies are there in the US in 2024?
Currently, there are 7.9 million online retailers in the world, of which 2.1 million are in the United States.
Conclusion
We hope you found these eCommerce statistics enlightening and that they’ve made you appreciate how vital digital and online retail is for the future.
The recent pandemic has made many business owners rethink their approach to making sales, and the popularity of eCommerce is likely to continue to increase over the next few years.
We have the following sources to thank for the information we’re sharing with you.
- Ecommerceguide
- Bigcommerce
- Oberlo
- Statista
- Shopify
- Themediacaptain
- Insiderintelligence
- Ecommercedb
- Netsuite
- Wpforms
- Oberlo
- Agiratech
- Websiterating
- Readycloud
- Nosto
- Emarketer
- Outerboxdesign