
You’ve successfully worked hard on your marketing strategy, moved the shopper through the sales funnel, and provided offers to entice them and pique their interest, only to find they’ve abandoned their cart just before they completed their purchase.
It’s a frustrating position to find yourself in, but with the help of these cart abandonment stats, you’ll uncover some of the ways you can correct the common issues for eCommerce retailers and understand why your customer fails to complete their purchase.
General Shopping Cart Abandonment Rates, Trends, Facts, and Statistics 2024
- E-commerce brands lose $18 billion in sales revenue each year because of cart abandonment.
- December is the month when cart abandonment is at its highest.
- In 2019, the average cart abandonment rate was 77.13%.
- Abandonment is most common between 6 pm and 9 pm.
- Almost nine out of ten carts get abandoned on Saturday and Sunday.
- Abandoned carts cost e-marketers around two to four trillion US dollars every year.
- Retailers have identified millennial shoppers as the most indecisive, followed by 18-24-year-olds.
- 66% of millennials prefer to wait for a product to go on sale before purchasing.
- 39% of retailers say that women are more likely to abandon their online shopping carts
- 99% of new visitors won’t make a completed purchase on their first visit.
- At the start of the pandemic, browse abandonment rose to 94.4%.
Global Average Shopping Cart Abandonment Stats
- Spanish shoppers abandon their carts on average 86.15% of the time.
- Shoppers in the Netherlands have the lowest abandonment rate at 65.49%.
- The US has the second-lowest average cart abandonment rate at 71.86%.
- UK shoppers abandon online baskets worth almost £30 a month per shopper.
- In 2020, one-third of UK shoppers who left their carts came back to finalize the transaction.
- Asia-Pacific countries have the highest cart abandonment rate, while European countries have the lowest.
Industry Cart Abandonment Stats 2024
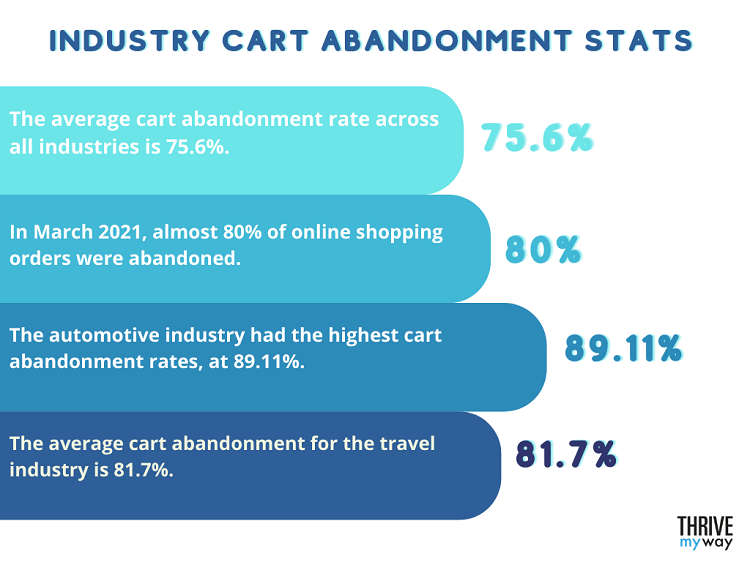
- The average cart abandonment rate across all industries is 75.6%.
- In March 2021, almost 80% of online shopping orders were abandoned.
- The automotive industry had the highest cart abandonment rates, at 89.11%.
- The categories that are most prone to “website window-shoppers” are women’s knitwear, leather goods, and lingerie.
- The average cart abandonment in the travel industry is 81.7%.
- Gaming sites experience the lowest abandonment rates.
Average Shopping Cart Abandonment Rate by Device

- Mobile users have one of the highest cart abandonment rates of 85.65%.
- The desktop cart abandonment rate is 69.75%.
- The cart abandonment rate for tablets is 80.74%.
Abandoned Cart Recovery Email Statistics
- The best time to send cart abandonment emails is around an hour after purchase.
- Open rates for cart abandonment emails vary. For example, for travel, it’s 46.94%, for utilities, it’s 44.92%, for retail, it’s 39.07%, and for fashion, it’s 29.48%.
- The average open rate for cart recovery emails across all sectors is 40.10%.
- Around half of the cart abandonment email recipients who engaged with the email content will complete their purchase.
Average Conversion Rate for Cart Abandonment Statistics
- You can increase conversions by 35.62% with checkout optimization.
- Cart abandonment conversion rates by sector are as follows: fashion 28.89%, retail 28.88%, travel 22.80%, and utilities 16.12%.
- The average conversion rate for all sectors is 24.18%.
- If you want to boost the conversion of your cart abandonment emails, offer minimal shipping cost or free shipping.
- A 65% cart abandonment trend leaves a 97.9% gap in conversions.
Reasons for Shopping Cart Abandonment Statistics
- Extra checkout costs are the number one reason why shoppers abandon their carts.
- The number two reason for abandonment is being forced to create an account.
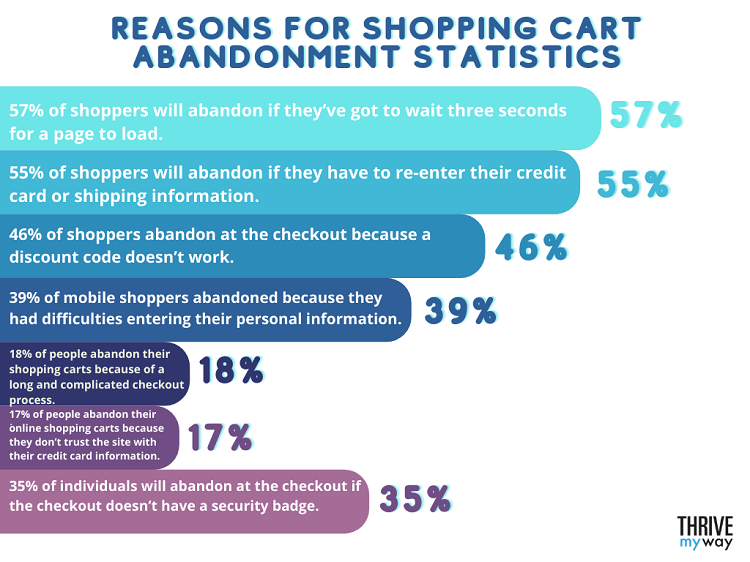
- 57% of shoppers will abandon if they’ve got to wait three seconds for a page to load.
- 55% of shoppers will abandon if they have to re-enter their credit card or shipping information.
- 46% of shoppers abandon at the checkout because a discount code doesn’t work.
- 39% of mobile shoppers abandoned because they had difficulties entering their personal information.
- 18% of people abandon their shopping carts because of a long and complicated checkout process.
- 17% of people abandon their online shopping carts because they don’t trust the site with their credit card information.
- 35% of individuals will abandon at the checkout if the checkout doesn’t have a security badge.
Ecommerce Shopping Cart Abandonment Effects Statistics
- Research from Statista found that when UK shoppers abandon carts, less than a third return to buy while a quarter of them will buy the same product from a competitor.
Solutions to Abandoned Cart Statistics
- The best-optimized checkout process has a checkout abandonment rate of 20%.
- 25% of shoppers say a PayPal payment option gives them the best sense of security.
- 80% of shoppers will not make a purchase unless there is a hassle-free return policy.
- The average large-sized eCommerce store can gain a 35.26% increase in conversion rate through a better checkout design that includes a guest checkout option.
- The average site has 39 potential areas for checkout page improvements.
- On average, visitors spend 30% more when there are no delivery charges.
- Sales rise by up to 45% after removing the mandatory registration of shoppers.
- 72% of all people aged 25-34 were very likely to buy a product they left in their carts if offered it again but at a discounted price.
- An optimized checkout process can have a maximum of seven form fields and 12 form elements.
- The most prominent online shopping incentives are free shipping (79%), free returns or exchanges (54%), same-day shipping (42%), next-day shipping (40%), straightforward online returns (36%), and two-hour or less shipping (21%).
- Use a tool such as Enhanced Ecommerce (EEC), a Google Analytics plug-in, to give you a better insight into the shopping behavior of visitors.
Abandoned Cart Recovery Statistics
- If you use retargeted ads, it could send 26% of shoppers back to your site.
- Personalized retargeted ads can lead to ROIs of more than 1,300%.
You might be interested to check those related posts as well:
- Useful Online Shopping Stats [2023]
- 111 Amazing Shopify Stats 2024 [Facts and Trends]
- 118 Essential B2C Content Marketing Stats 2024 [Facts and Trends]
Conclusion
Average shopping cart abandonment rates are at an all-time high.
However, there are strategies you can adopt and improvements you can make that will encourage more customers to go through with their online orders.
The most notable improvement for a potential customer is in the checkout design and checkout flow.
The main aim is to improve the user-friendliness of your eCommerce platform and reduce the number of cart abandoners.
An improved shopping experience will do wonders for your conversion rates.
These cart abandonment statistics were compiled with the help of the following resources:
- Sleeknote
- Statista
- Shopify
- Baymard
- Salecycle
- Moosend
- Barilliance
- TechJury
- 99Firms