
Business-to-consumer marketing (B2C) is a process of selling products and services directly between the business and the consumers.
More and more B2C companies are starting to recognize the power of internet content and use it to increase brand awareness, build relationships with their customers, and promote their products or services.
In this article, we have gathered 117 of the latest B2C content marketing stats, facts, and trends that will give you a deeper view of the content marketing industry.
Thanks to this data, you will understand how to use content more effectively to grow your business.
General B2C Content Marketing Stats 2024
- 82% of marketers are actively investing in content marketing.
- The global content marketing industry is expected to grow at an annual growth rate of 16%.
- By 2025, the global content marketing industry is projected to grow by $417.85 billion.
- Content marketing generates three times more leads than other types of marketing.
- Content marketing also boosts conversion rates that are six times higher than other advertising methods
- On average, content marketing costs 62% less than other types of marketing.
- The number of businesses using content marketing increased from 70% in 2019 to 82% in 2020.
- 49% of B2C companies outsource content marketing.
- 75% of organizations outsource content creation due to its time intensity.
- 40% of outsourcing organizations delegate content distribution, while 25% outsource their entire content strategy.
- 50% of online marketers use content marketing to generate leads.
- 79% said that in 2021 lead generation was their main content marketing priority.
- In 2021, 54% of B2C content marketers noticed that their budgets remained stable, with 27% noting that their budgets had increased and 18% noting that their budgets had decreased.
- As of 2021, 62% of B2C content marketing teams remained stable in size, while 27% increased and 11% decreased in size.
Images and Photos Content Marketing Statistics
- In 2020, 48% of content marketers surveyed said that 91-100% of their content includes visuals, while 23% said they included visuals in 70-90% of their content.
- Internet users typically read only 20% of all the text on a webpage during their visit.
- 65% of people are visual learners.
- On average, people remember only 10% of written content and 65% of visual content.
- 26% of content marketers predict relying over 80% of their marketing strategies on visuals.
- 25% of marketers predicted that they would invest between 10% and 20% of their total budgets on visual content creation.
- 74% of marketers use visuals consistently in over 70% of the written content pieces they publish.
- 90% of bloggers add visual content to their blog articles, but only 3% include over ten images per blog post.
- Including more than ten images in a blog post increases the chances to get better results by 39%.
- On average, marketers spend two hours per week creating visual content.
- 43% of content marketers struggle at producing visual content consistently.

Video Content Marketing Statistics
- On average, people watch around 16 hours of video content per week.
- In 2020, the value of the global video streaming market was estimated at $161.37 billion.
- 85% of businesses use video content in their marketing strategy.
- 90% of consumers claim that they prefer video content from their favorite brands to other types of content.
- 91% of marketers are happy with their video content’s ROI.
- 52% of content marketers say video content has the best ROI.
- 80% of people search for video content before buying.
- 55% of content marketers use YouTube videos in their content strategy.
- 49% of content marketers use Facebook videos in their content strategy.
- Only 25% of content marketers use Instagram stories in their content strategy.
- 18% of content marketers do not use video content at all.
- 78% of website owners claim that their website traffic has increased thanks to video content.
- Only 18% of people prefer reading a written article rather than watching a short video on the topic.
- 68% of people will finish watching a video that lasts less than a minute.
- 55% of people watch video content daily
- Websites with video content have an average conversion rate of 4.8%, compared to 2.9% for websites that do not use any video content at all
- On average, landing pages with videos have a conversion rate of 80%.
Webinar Marketing Statistics
- 61% of marketers include webinars in their content strategy.
- The pharmaceutical industry has the highest live webinar attendance rate at 63%, followed by the consulting industry (50%) and the advertising industry (33%).
- 83% of content marketers consider webinars to be an effective strategy.
- 45% of marketers prefer to promote their webinars via email marketing.
- More people like to watch 60-minute webinars than 30-minute webinars.
- Tuesdays are the days with the most webinar registrations (24%), followed by Thursdays (16%) and Wednesdays (15%)
- On average, between 2% and 5% of attendees purchase something at the end of the webinar.
- 92% of people attending a webinar expect a Q&A session at the end.
- 93% of participants attend webinars from their desktops and only 7% from mobile devices.
- Webinars in the communication industry have the highest conversion rate (67%), followed by training webinars (44%) and marketing webinars (39%).
- 58% of marketers use webinars to promote their products or services.
- 89% of marketers claim that webinars are the most effective lead generation strategy.
- 29% of marketers run up to 100 webinars per year.
- 35% of webinar attendees sign up for it up to 7 days in advance.
- Only 39% of B2C businesses hosted webinars in 2020, compared to 67% of B2B businesses.
- Webinar setup costs range between $1,000 to $3,000, although some webinars can cost less than $100 to set up.
- On average, 78% of webinars have less than 50 attendees.
Audio and Podcast Statistics
- As of 2021, there are over 2 million podcasts.
- The number of podcasts has grown by over 400% since 2018.
- The average number of monthly podcast listeners is expected to grow to 144 million by 2026.
- 78% of Americans know what a podcast is.
- There are over 160 million podcast listeners in the US, which accounts for almost 50% of the US population.
- In 2021, 41% of Americans over 12 years old listened to podcasts every month.
- 60% of American consumers over 12 years old listen to podcasts.
- The number of podcast listeners has doubled in the last decade in the US.
- As of 2021, The Joe Rogan Experience is the most listened-to podcast in the US.
- Surprisingly, 65% of all podcast listeners listen to the whole podcast episode.
- 68% of all podcast listeners listen to all of the podcast episodes they have downloaded.
- In 2020, 68% of Americans over 12 years old listened to some type of online audio each month.
- In 2020, 14% of Americans over 55 years old listened to a podcast monthly.
- 54% of podcast listeners in the US are male, and 46% are female.
- 79% of podcast listeners listen to podcasts on their mobile phones, while only 15% listen to them on their laptops.
- 28% of podcast listeners listen to podcasts as an audio source in their car.
- 81% of people tune into radio stations while driving.
- 8:15 am, 8:30 am, 11:00 am, 11:15 am, and 5:30 pm are the peak podcast listening hours.
- 28% of Americans over the age of 12 listen to podcasts every week.
- On average, US podcast listeners listen to 8 different podcasts weekly.
- 21% of podcast listeners listen to four or five different podcasts in a week.
- Only 11% of podcast listeners focus on listening to only one podcast in a week.
- The average weekly online audio listening time in 2020 was around 15 hours and 12 minutes.
Statistics on Content Marketing Channels 2024

- In 2021, webinars and online course content increased by around 12% from the previous year.
- In 2021, live-streaming content increased by over 22%.
- Blog posts and short articles were the most common content form used by B2C marketers in 2020 (83%).
- Long-form articles (over 3,000 words) were the least common content form used by B2C marketers in 2020 (22%).
- In 2020, 75% of B2C marketers used email marketing as their top content marketing strategy.
- 72% of B2C marketers used paid channels for content marketing in 2020, accounting for a 13% drop from the previous year.
- Surprisingly, Facebook is the most common social media platform that B2C marketers used in 2020 (97%)
- The use of Instagram by B2C content marketers in 2020 increased by 7%, while the use of YouTube increased by 10%.
- 74% of Facebook users use it for business purposes.
- 57% of all web content is shared on Facebook.
- 56% of users use YouTube to learn something new.
- 65% of users use YouTube to look for a solution to a problem.
Content Promotion and SEO Statistics 2024
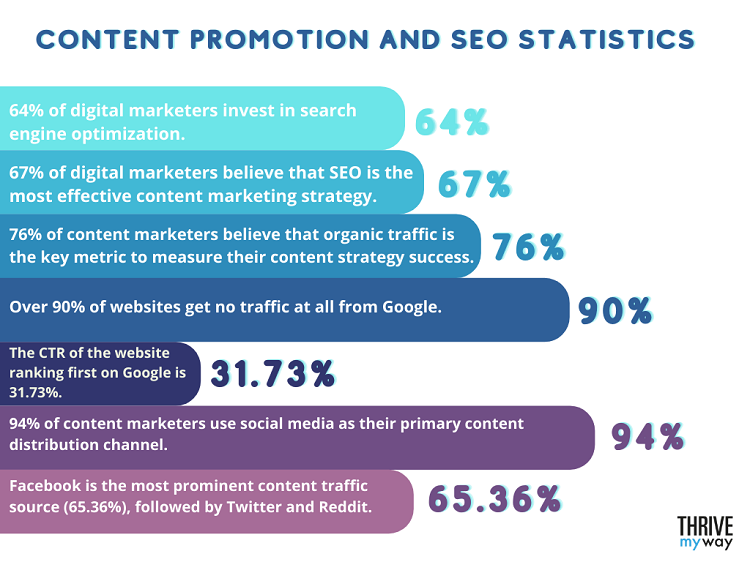
- 64% of digital marketers invest in search engine optimization.
- 67% of digital marketers believe that SEO is the most effective content marketing strategy.
- 76% of content marketers believe that organic traffic is the key metric to measure their content strategy success.
- Over 90% of websites get no traffic at all from Google.
- The CTR of the website ranking first on Google is 31.73%.
- B2C-oriented content gets almost ten times more shares than B2B-oriented content.
- 94% of content marketers use social media as their primary content distribution channel.
- Facebook is the most prominent content traffic source (65.36%), followed by Twitter (10.03%) and Reddit (8.95%).
Mobile Content Marketing Statistics
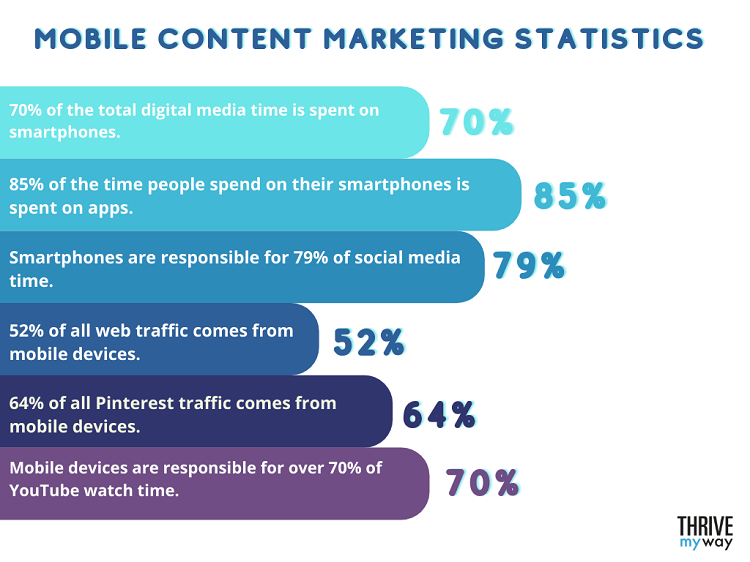
- 70% of the total digital media time is spent on smartphones.
- 85% of the time people spend on their smartphones is spent on apps.
- Smartphones are responsible for 79% of social media time.
- 52% of all web traffic comes from mobile devices.
- 64% of all Pinterest traffic comes from mobile devices.
- Mobile devices are responsible for over 70% of YouTube watch time.
B2C Content Marketing During Pandemic Statistics
- 63% of B2C organizations have changed their targeting and/or messaging strategy due to the COVID-19 pandemic.
- 54% of B2C organizations adjusted their content calendar due to the pandemic.
- 46% of B2C companies changed their promotion strategy due to the pandemic.
- 82% of businesses adjusted their content strategy to the pandemic very quickly.
- 83% of B2C businesses relied on blog posts and short articles during the pandemic.
- During the pandemic, 74% of B2C businesses relied on email newsletters.
- During the pandemic, 62% of B2C businesses relied on pre-recorded videos.
- The number of marketers using in-person events to promote their business dropped by 11% between 2019 and 2020.
- The number of marketers using online events, webinars, and online courses in 2020 increased by 12% from 2019.
- The number of marketers using live streaming in 2020 increased by 22% % from 2019.
- 82% of B2C marketers used social media to distribute their content organically during the pandemic.
You might be interested to check those related posts as well:
- 99 Important Email Marketing Stats 2024 [Facts and Trends]
- How to Create a Content Marketing Strategy 2024 [Detailed Guide]
- 120+ Powerful B2B Marketing Stats and Trends [2023]
FAQ
What is the average size of a B2C organization’s content marketing team?
An average B2C organization has a team of two to five people dedicated to content marketing.
This is true for both smaller and bigger companies.
How many B2C organizations outsource content marketing activities?
It is estimated that 55% of all B2C businesses outsource some part of their content marketing activities.
Moreover, 80% of those businesses choose to outsource content creation specifically, as it is the most time-consuming content marketing activity.
What is the success rate of B2C organizations’ content marketing?
Only 5% of digital marketers rate their B2C organizations’ content marketing efforts as extremely successful.
In comparison, 1% think that their content marketing efforts are not successful at all.
Almost half of online marketers believe that their B2C organizations’ content marketing is moderately successful.
Conclusion
There is no doubt that good content goes a long way.
Implementing the right content strategy into their marketing efforts can help companies reach a wider audience, generate leads, and increase conversion rates.
In addition, content is an excellent tool to answer your audience’s most pressing questions.
You can do that via various content marketing channels, such as video content, blog articles, or podcast episodes.
Producing high-quality content can help your business grow much faster, which is why it is important to truly focus on your content marketing efforts.
The B2C content marketing statistics provided in this article will give you a new perspective on improving your content and using it to your advantage.
The data in this article was gathered from the following sources: Statista, Podcast Insights, Hubspot, Ziflow, OptinMonster, and more.