
In the past few years, the growth of online businesses has skyrocketed. Many factors have contributed to this including the Covid pandemic, changes in consumer behaviors, and developing technologies. In this article, we look at some of the online business stats that are pushing business growth online.
eCommerce Online Business Stats 2024
Here are some statistics on how eCommerce businesses are succeeding online with ease.
Lead Generation Statistics
- The biggest challenge for 61% of marketers are generating traffic and leads for their websites.
- 34% of brands believe their number one priority for 2022 will be lead generation.
- Lead generation is used as a KPI of marketing success for 40% of brands.
- 53% of marketers allocate more than half (53%) of their budget to lead generation campaigns.
- Outbound marketing activities are now only preferred by 18% of marketers for lead generation.
- Four out of every five marketers think automation improves lead generation.
- Form submissions are utilized by 84% of marketers to collect details from leads.
- The second delay in your website loading speed can cost you 7% of your leads.
- A lead is more likely to convert if the brand follows up within five minutes.
Content Marketing and Blogging Statistics
- 82% of brands currently have an active content marketing campaign.
- 28% of marketers are planning on investing in new content marketing campaigns, this is up from 17% in 2021.
- 62% of marketers measure the success of content marketing campaigns with how many sales they make.
- 52% of brands will blog regularly as part of their content marketing strategy.
- 43% of brands will increase their content marketing budgets in 2022, and only 11% will decrease budgets.
- There are 2.5 billion blog articles published every year.
- During the pandemic, 35.19% of brands that blogged reported an increase in revenue.
Video Marketing Statistics
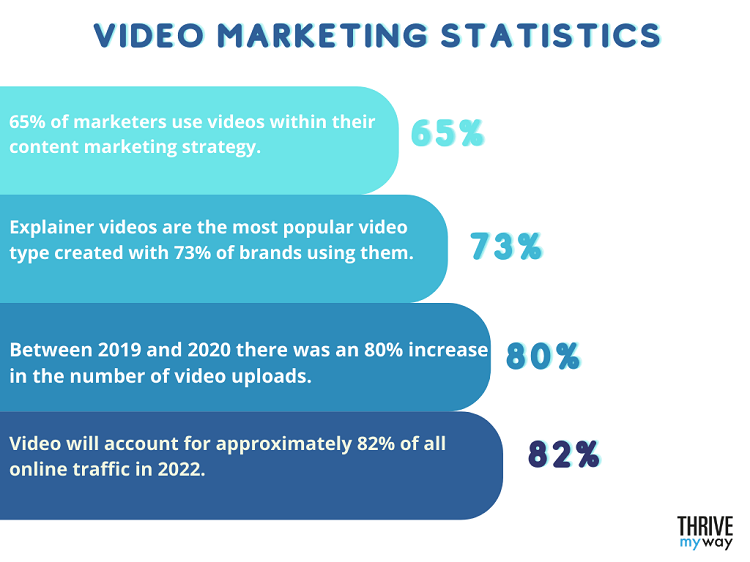
- 65% of marketers use videos within their content marketing strategy.
- Explainer videos are the most popular video type created with 73% of brands using them.
- Between 2019 and 2020 there was an 80% increase in the number of video uploads.
- Most marketing videos are less than one minute long.
- Consumers watch more than 12.2 billion minutes of online video content every year.
- Video will account for approximately 82% of all online traffic in 2022.
- Videos are 53 times more likely to be ranked on the first page of a relevant search result.
Email Marketing Statistics

- 77% of online marketing experts have seen an increase in email marketing engagement.
- 34% of brands send two or fewer emails a week to their subscribers.
- Personalized messages are by far the most used types of content with 27% of brands using them.
- MailChimp (30%) and Constant Contact (29%) are the most popular email marketing software tools.
- In 2022, 347 billion emails will be sent every single day by brands.
- There are few complaints for brands that send four or fewer emails per week to subscribers.
- Fashion brands have higher read and click-through rates when they send between 6 and 7 emails per week.
- Sending between 10 and 19 emails per month can yield the best ROI with subsequent orders being $18.59 on average.
- Sending more than 20 emails per month drastically reduces your average order value to just $6.35 per order.
- Tuesday and Thursday are the best days to send email marketing.
Social Media Statistics
- LinkedIn provides the best value for money for B2B brands with 77% of marketers saying the platform offers positive ROI.
- Twitter has one of the poorest ROIs for B2B brands with only 17% of brands reporting a positive result.
- Facebook (43%) and Instagram (35%) have the best ROI for B2C brands according to marketing teams.
- Social listening is the most important tactic for brands in 2022.
- 46% of brands plan on using live videos on their social media channels in 2022.
- There has been a 9.9% increase in the use of social media by consumers since 2020.
- The average consumer spends two hours and 27 minutes on social media every day.
- 93% of internet users are on at least one social media network regularly.
- Live videos have, on average, 38 interactions per post on Facebook.
- The longer videos are on social media the larger reach they will have and the more interactions they will generate.
Affiliate Online Business Statistics
- In 2022, the affiliate marketing industry will be worth $8.2 billion.
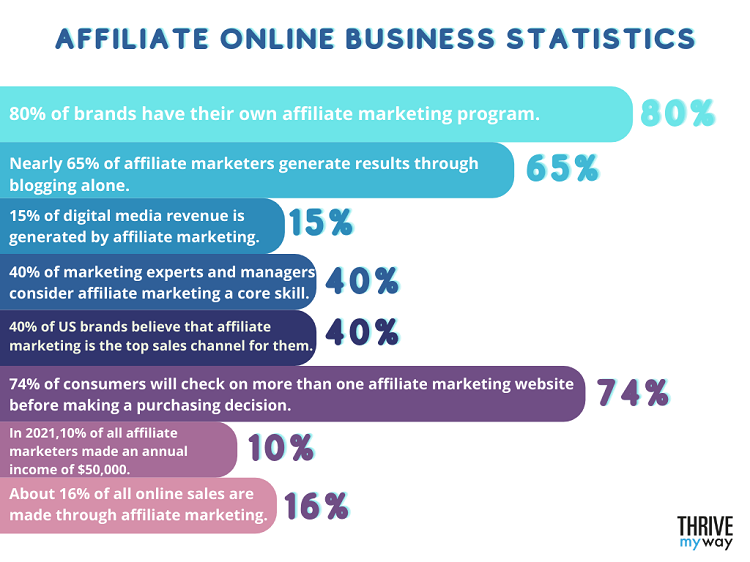
- 80% of brands have their own affiliate marketing program.
- Nearly 65% of affiliate marketers generate results through blogging alone.
- 15% of digital media revenue is generated by affiliate marketing.
- A quarter of all affiliate marketing programs are within the fashion industry.
- 40% of marketing experts and managers consider affiliate marketing a core skill.
- 40% of US brands believe that affiliate marketing is the top sales channel for them.
- 74% of consumers will check on more than one affiliate marketing website before making a purchasing decision.
- In 2021, nearly 10% of all affiliate marketers made an annual income of $50,000.
- About 16% of all online sales are made through affiliate marketing.
Online Shopping Statistics
- Mobile sales grew by more than 22% between 2020 and 2021.
- 78% of consumers expect products to include at least one image.
- 55% of consumers will abandon a purchase because tax or shipping fees are too high.
- 16% of online shoppers complete a purchase at least once a week.
- 80% of US consumers now shop online, at least occasionally.
- Women (72%) are more likely to shop regularly online than men (68%).
- 63% of millennials will use social media as part of their purchasing journey.
- 56% of US consumers will use their Smartphones to buy something in 2022.
- Optimizing the checkout experience for consumers can increase conversions by 35.26%.
- 53% of consumers are more likely to purchase if free shipping is offered.
Online Business Growth Statistics
- 79% of entrepreneurs with a business website expect their business to grow at least 25% in the next three to five years. This is compared to 64% of those with no website. If you haven’t got one, there’s no time like the present to build a website.
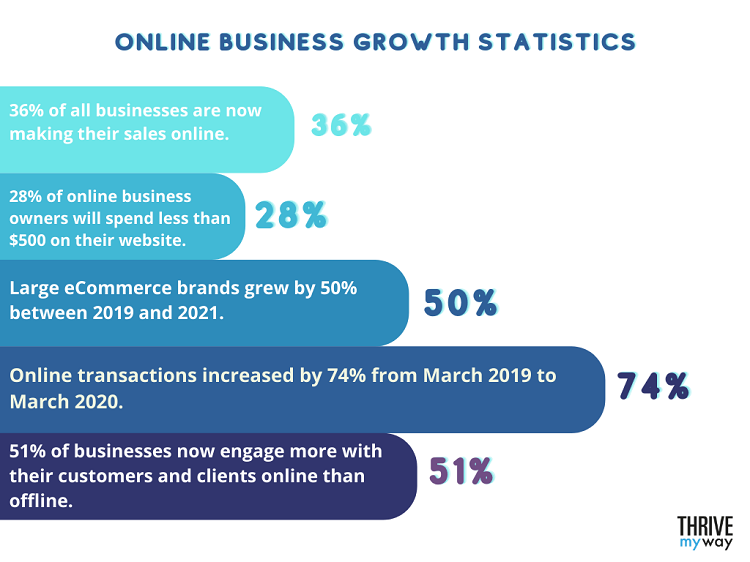
- 36% of all businesses are now making their sales online.
- 28% of online business owners will spend less than $500 on their website.
- Large eCommerce brands grew by 50% between 2019 and 2021.
- Online transactions increased by 74% from March 2019 to March 2020.
- 51% of businesses now engage more with their customers and clients online than offline.
Online Business Failure Statistics
- 90% of eCommerce startups will fail within 120 days of operation.
- The main reasons why online businesses fail are poor marketing and no search engine visibility.
- 35% of online business owners believe that their eCommerce store will fail because they can’t compete with top brands.
- 32% of small online business owners say that lack of funds causes their business to close.
Online Business Statistics per Country
Not all countries have the same eCommerce penetration. Here is a breakdown of some online business statistics per country.
Online Business Statistics in the US
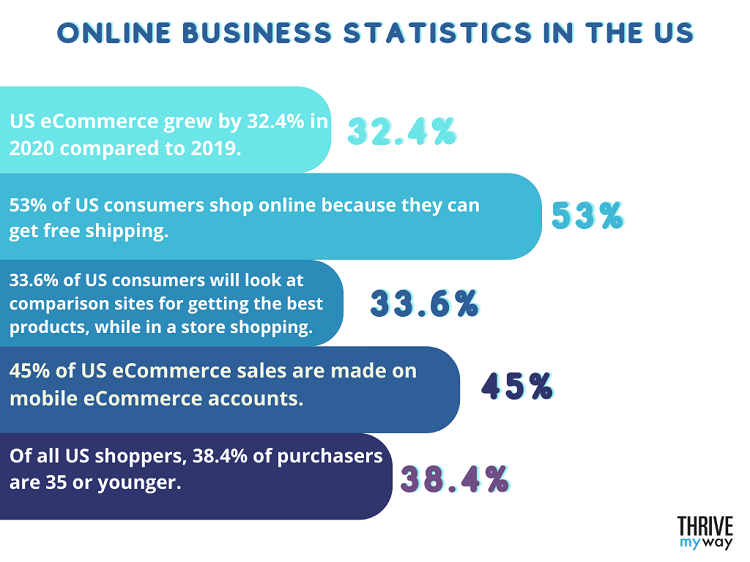
- US eCommerce grew by 32.4% in 2020 compared to 2019.
- One-third of US small businesses do not have a website.
- 53% of US consumers shop online because they can get free shipping.
- 33.6% of US consumers will look at comparison sites for getting the best products, while in a store shopping.
- 45% of US eCommerce sales are made on mobile eCommerce accounts.
- Of all US shoppers, 38.4% of purchasers are 35 or younger.
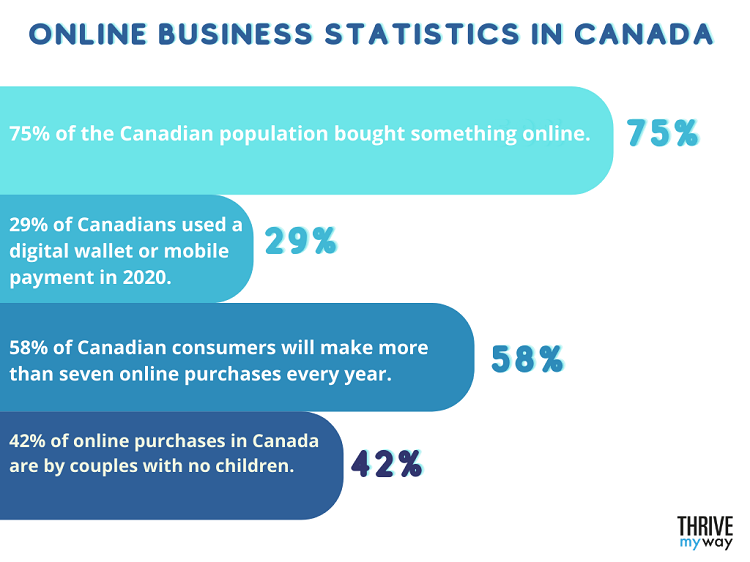
Online Business Statistics in Canada
- The average monthly revenue from online sales is 2.9 billion CAD.
- 75% of the Canadian population bought something online.
- 29% of Canadians used a digital wallet or mobile payment in 2020.
- 58% of Canadian consumers will make more than seven online purchases every year.
- 42% of online purchases in Canada are by couples with no children.
Online Business Statistics in Australia
- 9.1 million Australians have shopped online in 2021.
- Consumers aged between 35 and 44 spend the most online.
- Online sales made up 2% of the GDP of Australia.
- 90% of mobile phone owners will use their devices for shopping.
- Australian businesses saw an increase in sales of 55% in 2020 compared to 2019.
Online Business Statistics in the UK
- 87% of UK adults shopped online in 2020, which is up from 82% in 2019.
- 55% of adults in the UK buy clothes online.
- Sales of online groceries increased by over 80% in 2020.
- In November 2020, 36% of all retail sales were made online.
- The average internet user in the UK spends £1,372.78 a year.
- 38% of UK consumers buy something online at least once a week, by far the most active region in the world. The US comes second with 26% of US consumers.
- PayPal is the most used online payment method in the UK with 49% of users preferring this method.
Online Business Statistics in China
- With $1.7 trillion in annual sales, China is the world’s biggest eCommerce market.
- Only 44% of the Chinese population has made an online purchase.
- 29% of retail sales in China are made online.
- 94% of Chinese customers will use mobile payments compared to just 45% of US consumers.
Online Business Statistics in Malaysia
- In 2020, online sales were recorded as $4.9 billion. In 2021, this had grown to $6.2 billion.
- 52% of online sales are made on Smartphones compared to 42% on desktops.
- 47% of consumers prefer to shop online because it is more convenient.
- 27% of online sales are for electronic goods.
Internet Business Statistics in the Future

- In 2025, online sales will be worth 23.6% of all retail sales.
- Live streaming on US eCommerce websites will generate $25 billion in revenue by 2024.
- Worldwide online sales will grow to $6.542 trillion in 2024.
Online Business vs Offline Business Statistics
- 82% of consumers use online media every day compared to offline media (24%).
- Online sales grew by more than 50% between 2013 and 2018, during the same period, offline sales grew by just 10%.
- In 2020, total retail sales declined by 3.9% while online sales grew by 14.8%.
You might be interested to check those related posts as well:
- 33 Interesting Vimeo Stats 2024 [Facts and Trends]
- 123 Best Video Marketing Stats [You Should Know] for 2024
- 120 Impressive Social Media Stats 2024 [Facts and Trends]
FAQ
What are online business statistics?
Online business statistics cover all statistics that are related to the performance and sales of businesses on the internet. This can include how businesses interact with consumers across channels and how consumers make purchases online.
What is the success rate of online businesses?
About 90% of online business owners will not last 120 days. Beyond this, about 70% of businesses, that survive the first 120 days, will fail within the first five years of their operations. One of the main reasons why online businesses fail is that they don’t have the right investment or skills to sell online.
What percentage of small businesses sell online?
About two in every three businesses have an online presence. But not every business has eCommerce capabilities, with only about half of those with websites able to take online payments. This equates to approximately 24 million online shops around the world.
How many businesses are now online?
There are millions of businesses around the world. Only about 1/3 of businesses do not have a website, but about half of these businesses are expecting to build a website within the next 12-24 months. The average small business owner will use WordPress, Squarespace, or Shopify to create their online presence.
Conclusion
Online business is growing. Whether you’re selling business services or retail products, knowing the statistics of the industry is important. These statistics can guide you in your future strategy and help you improve your internet business.