If you are a business owner, you may already be using email marketing to grow your business.
Over the last few years, more and more companies have started to incorporate email marketing strategies to communicate with their existing customers, build stronger relationships, and promote their products or services.
In fact, many marketers believe that email marketing is much more effective than using social media to promote their businesses.
To show you how effective email marketing is, we have compiled a list of 99 important email marketing statistics, trends, and facts.
This list will help you better understand how to effectively use email marketing to grow your business, establish relations with your customers, and increase revenue.
Key Email Marketing Stats 2024
Email marketing has been on the rise over the last year.
In 2020, many business owners switched from traditional marketing to implementing different online marketing tools to grow their businesses.
Here are a few of the most important email marketing statistics.
- The number of daily email users is expected to grow from 4 billion in 2021 to 4.6 million by 2025.
- It is estimated that the email marketing industry was worth $7.5 billion in 2020.
- By 2027, the global email marketing industry is expected to grow by 138%.
- In 2019, there were over 5.6 billion active email accounts.
- It is estimated that in 2020, approximately 306.4 billion emails were sent and received every day.
- By 2024, the number of emails sent and received per day is expected to grow to 361 billion.
- In 2019, $350 million was spent on email advertising in the United States.
- Email is the main lead generation channel for 89% of digital marketers.
- 29% of digital marketers claim that email marketing is the most effective marketing channel.
- 80% of marketers would choose email marketing over social media.
- 72% of customers prefer to receive all business communication via email.
- Email is the main communication tool for 52% of people.
- The ROI for email marketing is 4200% (every email generates $42 for every $1 spent).
- Over 50% of customers claim that accurate marketing emails influence their buying decisions.
- 51% of emails are sent on Tuesdays (17%), Wednesdays (16%), and Thursdays (18%).
Email Marketing Demographics Statistics
To better understand how people use email as a communication and marketing channel, let’s take a look at some email marketing demographics statistics.
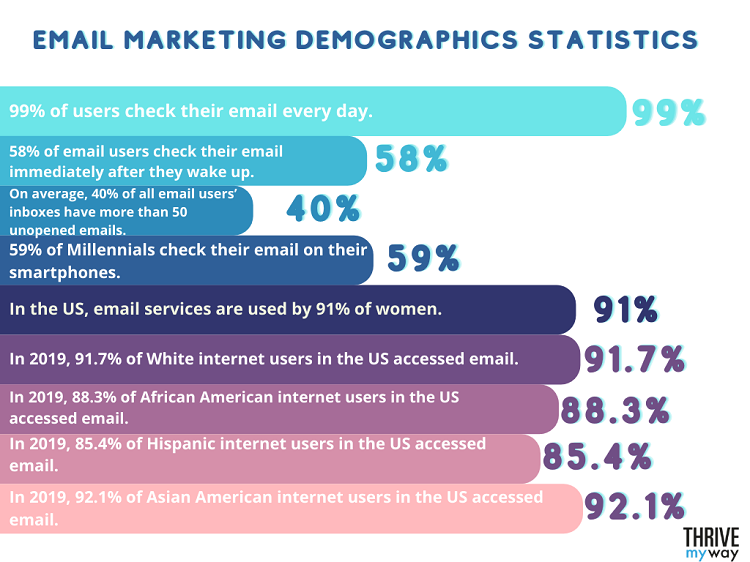
- 99% of users check their email every day.
- 58% of email users check their email immediately after they wake up.
- Most people tend to check their email multiple times per day.
- On average, 40% of all email users’ inboxes have more than 50 unopened emails.
- 59% of Millennials check their email on their smartphones.
- In the US, email services are used by 91% of women and 89% of men.
- In 2019, 91.7% of White internet users in the US accessed email.
- In 2019, 88.3% of African American internet users in the US accessed email.
- In 2019, 85.4% of Hispanic internet users in the US accessed email.
- In 2019, 92.1% of Asian American internet users in the US accessed email.
Email Campaign Statistics
A very carefully designed and thought-out email campaign can help marketers increase their revenue significantly.
Here are the most important email campaign statistics to help you create better email campaigns for your customers.
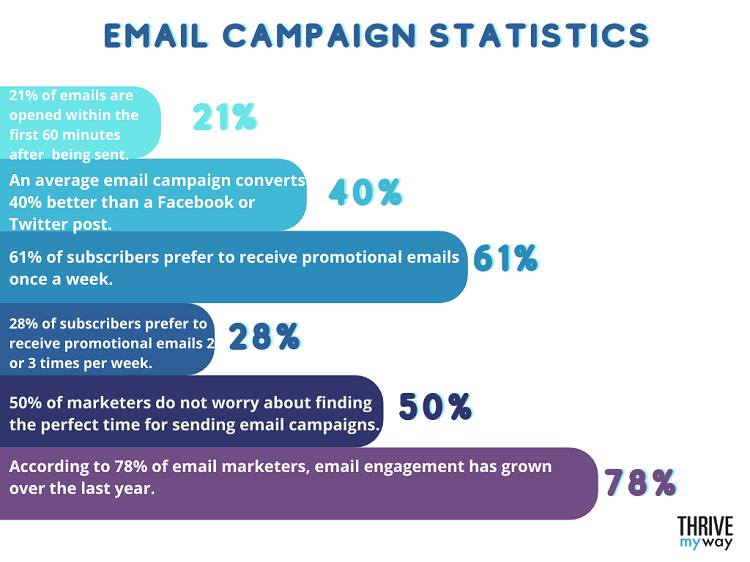
- 21% of emails are opened within the first 60 minutes after being sent.
- An average email campaign converts 40% better than a Facebook or Twitter post.
- 61% of subscribers prefer to receive promotional emails once a week.
- 28% of subscribers prefer to receive promotional emails 2 or 3 times per week.
- The best days to send out email campaigns are Tuesdays and Thursdays.
- Email campaigns have the highest open rates on Fridays.
- Email campaigns have the lowest open rates on Saturdays.
- 50% of marketers do not worry about finding the perfect time for sending email campaigns.
- According to 78% of email marketers, email engagement has grown over the last year.
Email Click-Through Rates Statistics

The most important numbers of an email campaign are click-through rates, open rates, bounce rates, and unsubscribe rates.
So, let’s analyze the latest email rate statistics.
- As of 2021, the average click-through rate of an email is 11.3%.
- As of 2021, the average email open rate is 19.8%.
- In 2021, the average unsubscribe rate was 0.1%.
- The average bounce rate of an email in 2021 is 9.4%.
- The overall email bounce rate decreased by 6.6% between 2019 and 2021.
- The lowest email click-through rates are on weekends.
- There will be a 60% increase in click-through rates among emails with 35 or more lines of text compared to emails with roughly 20 lines of content.
- The highest click-through rate during the day is between 11 am and 2 pm.
B2B Email Marketing Statistics
More and more B2B marketers are using email marketing as their primary lead generation and content marketing tool.
Here are some of the most recent B2B email marketing statistics.
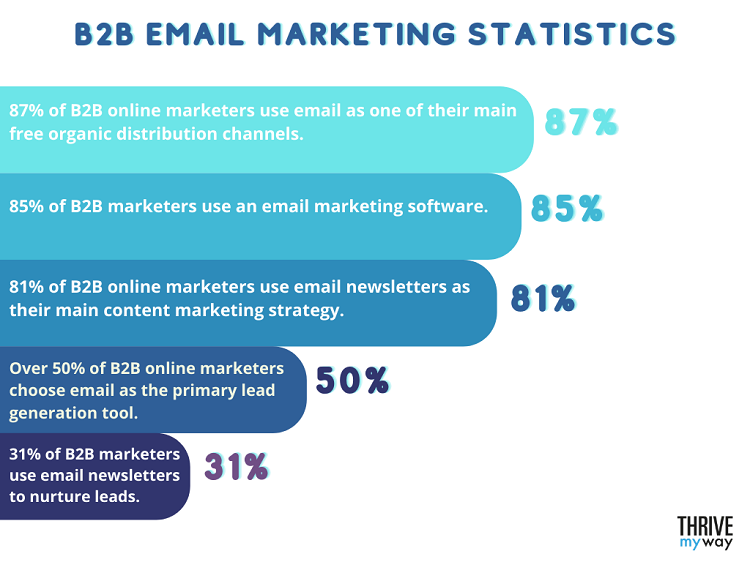
- 87% of B2B online marketers use email as one of their main free organic distribution channels.
- 85% of B2B marketers use email marketing software.
- 81% of B2B online marketers use email newsletters as their main content marketing strategy.
- Over 50% of B2B online marketers choose email as the primary lead generation tool.
- 31% of B2B marketers use email newsletters to nurture leads.
- On average, B2B marketers send an email marketing campaign every 25 days.
B2C Email Marketing Statistics
Most businesses claim that email marketing is their favorite and the most effective method of communication with their customers.
Here are the most recent B2C email marketing statistics that you should know about.
- 64% of entrepreneurs use email marketing to communicate with their customers.
- 35% of digital marketers email their customers between 3 to 5 times per week.
- 32% of marketers email their customers 2 or 3 times per month.
- 19% of marketers email their customers between 4 to 6 times per month.
- 17% of marketers email their customers only once a month.
- 50% of email recipients say that the most annoying thing about email marketing is receiving too many emails from a brand.
- On average, a welcome email campaign is opened by 80% of people who receive it.
- The open rate of a welcome email is four times higher than the open rate of other email types.
- 45% of email users do not open emails from an unknown source.
Email Marketing Statistics by Industry
Nowadays, almost all industries are currently using email marketing or have used it at some point.
So, let’s take a look at email marketing statistics across different industries.
- The average email open rate across all industries is 21%.
- Government-related emails have the highest open rates of approximately 28.7%.
- Religious emails have an average open rate of 27.6%.
- Emails in the travel and tourism industry have an average open rate of 32.6%.
- Emails in the education industry have an average open rate of 34.1%.
- The consulting services industry has the highest email click-through rate of 25%.
- The administrative and business support services industry has an average email click-through rate of 20%.
- Retail industry emails have the highest bounce rate of 26%.
Mobile Marketing Statistics
If you own a smartphone, then chances are that you check your email on your phone more than you check it on your desktop.
This is why more and more brands realize how important it is to optimize their email campaigns for mobile.
With that said, let’s look more closely at the latest mobile marketing statistics.
- As of 2019, Gmail had over 1.5 billion users and still is the most-used email service in the world.
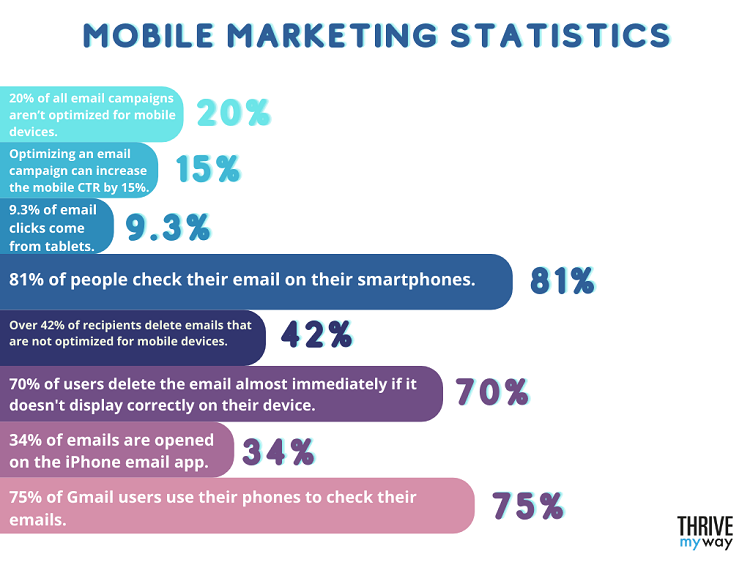
- 20% of all email campaigns aren’t optimized for mobile devices.
- Optimizing an email campaign for mobile devices can increase the mobile CTR by 15%.
- 9.3% of email clicks come from tablets.
- 81% of people check their email on their smartphones.
- Over 42% of recipients delete emails that are not optimized for mobile devices.
- 70% of users delete the email almost immediately if it doesn’t display correctly on their device.
- 34% of emails are opened on the iPhone email app, and 34% of emails are opened in Gmail.
- 75% of Gmail users use their phones to check their emails.
Email Segmentation and Personalization Statistics
There is no doubt that we are more likely to open an email that looks like it has been specifically tailored to us.
Well-thought-out segmentation and personalization can help businesses increase their conversion rates significantly.
So, let’s analyze some of the most important email segmentation and personalization statistics.
- 20% of retail and e-commerce businesses are personalizing their email campaigns based on their customers’ gender and/or race.
- It has been proven that segmented campaigns increase revenue by 760%.
- The click-through rate of segmented email campaigns is 50% higher than the click-through rate of unsegmented email campaigns.
- On average, segmented email campaigns have a 94% open rate and a 38% click-through rate.
- Email campaigns that include an emoji in the subject line have a 56% higher open rate.
- 65% of millennial email users and 37% of email users over 65 years old like to see visual elements, such as emojis, GIFs, and stickers in their marketing emails.
- List segmentation accounts for 51% of the most used email marketing strategies.
- 53% of email marketers do not use any segmentation or personalization in their email campaigns.
- 13% of email marketers use audience segmentation in their email campaigns.
- 88% of users claim they are more likely to open a personalized email.
- In general, addressing the email recipient by their first name increases click-through and open rates by 35%.
- Emails with a personalized subject line tend to have higher open rates by 22%.
- Email subject lines with the customer’s name have higher conversion rates than non-personalized subject lines.
Email Sending Automation Statistics
Email automation is one of the most important email marketing tools.
It helps email marketers improve their message targeting, increase their conversion rates, and keep their customer relationships growing.
Here are the most important email-sending automation statistics.
- 51% of email marketers are using automation.
- 64% of B2B marketers use email automation tools.
- 47% of all welcome emails are sent via an automation tool.
- 46% of all promotional and sales emails are sent via an automation tool.
- 30% of responders say that the biggest email automation benefit is saving time.
- 22% of responders say that the biggest email automation benefit is lead generation.
- More than 68% of marketers indicate that email automation dramatically improves email targeting.
- Triggered emails have an average unsubscribe rate of 0.58%.
- Triggered emails have an average spam complaint rate of 0.06%.
- Triggered emails have an average open rate of 46%.
- Triggered emails have an average click-through rate of 11%.
- Triggered emails are eight times more likely to be opened by the recipients.
You might be interested to check those related posts as well:
- 26 Best Email Marketing Software and Platforms [in 2024]
- 120+ Powerful B2B Marketing Stats and Trends [2023]
- 118 Essential B2C Content Marketing Stats 2024 [Facts and Trends]
FAQ
What is the average conversion rate for email marketing?
As of 2021, the average conversion rate of an email marketing campaign is around 15.11%.
This means that it has dropped slightly, by 0.11%, from 2020.
In 2019, the average conversion rate of an email campaign was slightly higher, at 18.49%.
What is the success rate of email marketing?
The success of an email campaign is measured by two main statistics: click-through rate and open rate.
A standard click-through rate of an average email campaign is around 2.78%, and the average open rate of an email campaign is approximately 21.80% across all industries.
By measuring your email campaigns against these two important benchmarks, you can determine whether your campaign was successful or not.
What’s a good open rate for emails in 2021?
A good open rate is an open rate that is equal to or above the average open rate of email campaigns across all industries.
Given that the average open rate for 2021 was estimated at 21.80%, we can say that a good open rate for emails in 2021 is equal to or above 21.80%.
What are email benchmarks?
Email benchmarks are metrics that a business uses to evaluate whether or not its email marketing campaign was successful.
The most common email benchmarks are open, click-through, bounce, and unsubscribe rates.
Conclusion
More and more marketers are noticing the importance and effectiveness of email marketing.
If you are a business owner and you aren’t using email marketing to grow your business, you should definitely consider it!
This list of 99 email marketing statistics, trends, and facts will show you how email marketing may impact the success of your business.
To create this list, we have gathered information from the following sources: Statista, Constant Contact, MailChimp, Campaign Marketer, Hubspot, and more.