
Understanding search engine optimization is a must for all business owners with an online presence.
While it is true that the SEO algorithm and best practices change rapidly and unexpectedly, it is still possible to keep up and stay relevant on Google searches.
If you create good content that answers the questions that people are searching for, you have a very high chance of ranking on the first page of Google. The more SEO-optimized your content is, the more traffic your website will get. This, in turn, will help your business grow significantly.
In this article, we present some fascinating SEO statistics to give you a solid understanding of the most critical aspects.
Here is a list of 159 most important SEO stats, trends, and facts.
General SEO Stats 2024
SEO has become a necessary skill for everyone working online. SEO has become so important that businesses in the US are spending billions of dollars on SEO services. Let’s analyze some of the key SEO statistics.
- The global SEO services market is expected to reach $120 billion in revenue by the end of 2021.
- There are over 239 million search engine users in the United States.
- An average search engine result has a 14.6% conversion rate compared to 1.7% for other strategies, such as cold calling or direct mail.
- Only 25% of all internet users visit the second page of a search engine while performing a search query.
- 75% of SEO is off-page, which means that the website’s content accounts for only 25% of the optimization.
- 40% of visitors abandon a website if it doesn’t load fast enough.
- 47% of visitors get impatient if the website doesn’t load in less than 2 seconds.
- Over 50% of people discover new businesses while performing a mobile search.
- A featured snippet is included in only 12.3% of all search queries.
- 99.22% of people won’t click on the second page of Google search results.
SEO Industry Statistics
There is no doubt that SEO is a fascinating industry. Since the launch of the first search engine in 1993, the SEO industry has been growing exponentially. Here are some of the most important 2020 and 2021 SEO industry statistics and facts.
- At the time this article was written, the SEO industry in the United States was estimated at over $80 billion.
- The top 3 industries with the highest average dwell time (the amount of time a user spends on the website before clicking back to search results) are higher education (3 minutes 34 seconds), sales and marketing (3 minutes 31 seconds), and solar energy (3 minutes 29 seconds).
- The top 3 industries with the highest bounce rates (the number of people who only view one page on the website) are higher education (51%), construction (47%), and IT staffing and services (44%).
- The top 3 industries with the highest conversion rates are legal services (7.5%), IT staffing and services (3.5%), and HVAC services (3.3%).
- An average SEO professional earns around $60,500 per year.
- SEO services cost, on average, between $100 and $150 per hour.
- On average, SEO services paid per-project cost between $500 to $1,000.
- Over 88% of SEO professionals charge around $150 per hour for their services.
- SEO specialists with over two years of experience in this industry charge 39.4% more per hour than their inexperienced counterparts, over 102% more for monthly retainers, and 275% more for one-off SEO projects.
- On average, SEO professionals who serve an international market charge over 130% more for a monthly retainer than SEO professionals who serve a local market.
Video SEO Statistics
Video content has been on the rise over recent years. Let’s see how video content is influencing SEO practices with these important video SEO statistics.
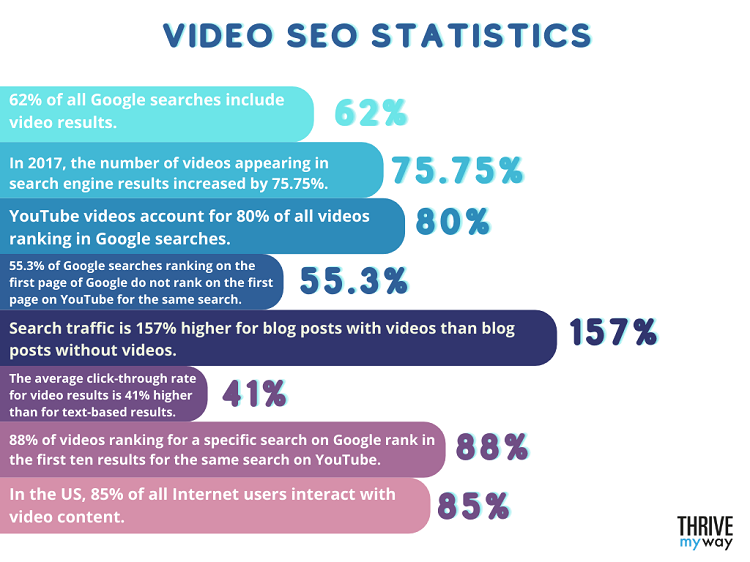
- 62% of all Google searches include video results.
- In 2017, the number of videos appearing in search engine results increased by 75.75%.
- YouTube videos account for 80% of all videos ranking in Google searches.
- 55.3% of Google searches ranking on the first page of Google do not rank on the first page on YouTube for the same search.
- On average, video results are 50 times more likely to rank organically in Google than text-based results.
- Video results are 53 times more likely to make it to the first page of Google.
- Search traffic is 157% higher for blog posts with videos than blog posts without videos.
- The average click-through rate for video results is 41% higher than for text-based results.
- 88% of videos ranking for a specific search on Google rank in the first ten results for the same search on YouTube.
- In the US, 85% of all Internet users interact with video content.
Mobile SEO Statistics
More and more people are using their smartphones to look up their burning questions on Google. Let’s analyze the latest mobile SEO statistics, trends, and facts.
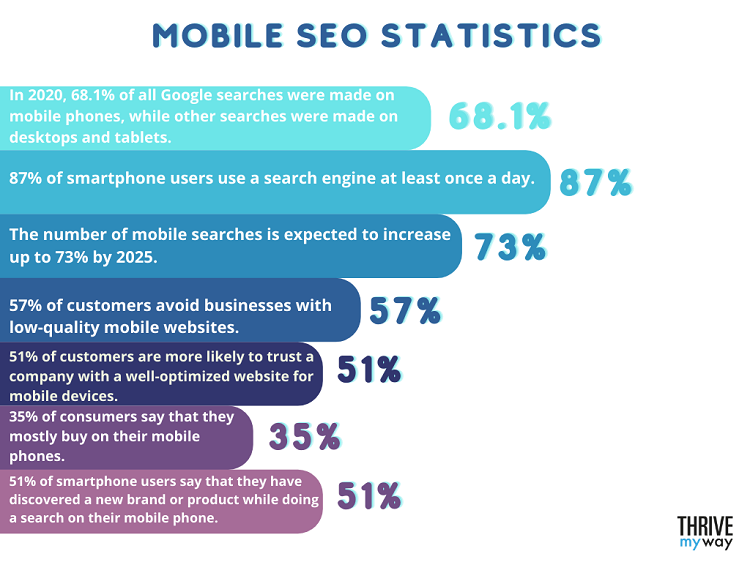
- In 2020, 68.1% of all Google searches were made on mobile phones, while 28.9% of searches were made on desktops and 3.1% on tablets.
- 87% of smartphone users use a search engine at least once a day.
- The number of mobile searches is expected to increase up to 73% by 2025.
- The number of mobile searches increased from 133.6 million in 2014 to 221 million in 2020.
- 57% of customers avoid businesses with low-quality mobile websites.
- 51% of customers are more likely to trust a company with a well-optimized website for mobile devices.
- More than half of all website traffic comes from mobile devices.
- 35% of consumers say that they mostly buy on their mobile phones.
- 51% of smartphone users say that they have discovered a new brand or product while doing a search on their mobile phones.
Voice Search Statistics
Voice search is becoming a more and more popular type of search query. With more people using the voice search option, let’s analyze the latest voice search statistics.
- Last 2022, 55% of US households will have at least one voice-enabled smart device.
- As of 2021, 41% of adults and 55% of teenagers use voice search daily.
- 75% of voice search results rank in the first three results on the first page of Google.
- On average, a voice search result is approximately 29 words long.
- 48% of users use voice search to perform general web searches.
- On average, a typical voice search result loads 52% faster than an average page.
- On average, a voice search is over 76.1% longer than a text-based search.
- 27% of all mobile searches are voice searches.
- Over 40% of all answers to voice searches on Google come from featured snippets.
- Approximately 2.68% of all answers to voice searches on Google come from FAQ pages.
- The average word count of a voice search results page is 2,312 words.
Keyword Statistics in the US

For your content to rank high on Google search, your content needs to contain specific keywords. Most SEO campaigns start with a keyword research process to find the best keywords to use in each particular piece of content. These keywords are chosen based on a combination of factors, such as search volume, competition, and commercial intent. Let’s take a look at the most crucial keyword statistics.
- The most popular keywords people search for are Facebook, with approximately 185 million searches per month, and YouTube, with around 151 million searches per month.
- 36% of SEO professionals claim that the headline or title tagline is the most important SEO element.
- 69.7% of all search queries are longer than four words.
- Approximately 95% of all keywords typed into a search engine have less than ten monthly searches.
- Only 0.01% of keywords have over 10,000 monthly searches.
- 71% of all keywords with over 10,000 searches per month have only one or two words.
- 29% of all keywords with over 10,000 searches per month are long-tail keywords (3 words or more).
- Long-tail keyword searches have a 3-5% higher click-through rate than generic searches.
- Questions account for 8% of all search queries.
- Less than 0.20% of the most popular keywords account for over 60% of all searches.
- The first five organic results on the first page of Google receive 67% of all clicks.
Backlink and Link Building Statistics

While it is no longer cool to drop your links all over the internet, digital marketers have to look for other ways to promote their businesses. Nowadays, growing your business is all about creating a solid backlink profile through social media mentions and shares, email marketing, guest posting, and influencer marketing. Here are some of the latest backlink and link-building statistics that can help you better understand these practices.
- A typical website ranking in the top position on Google has over 35,000 external backlinks.
- Backlinks account for 30% of the overall Google page score.
- Businesses with a blog have on average 97% more backlinks leading to their website.
- Over 66% of all websites don’t have any backlinks.
- Long blog articles tend to receive 77% more backlinks than short blog articles.
- Pages with a significant number of backlinks receive more organic Google traffic than pages with no or few backlinks.
- On average, $77.80 is the average cost of a guest post.
- $361.44 is the average cost of buying a link, while $150 is the lowest and $1,000 is the highest.
- 73.6% of websites have reciprocal links.
- 43.7% of the highest-ranking websites have a few reciprocal links.
- 41% of marketers feel that link-building is the most challenging marketing strategy.
- 42% of SEO professionals focus equally on building internal and external links.
Local SEO Statistics
Local SEO is a term that describes SEO practices focused on the company’s local area. If you serve local customers, making an effort to rank higher in local searches can help your business grow. Here you will find some key local SEO statistics to help your local business become more visible.
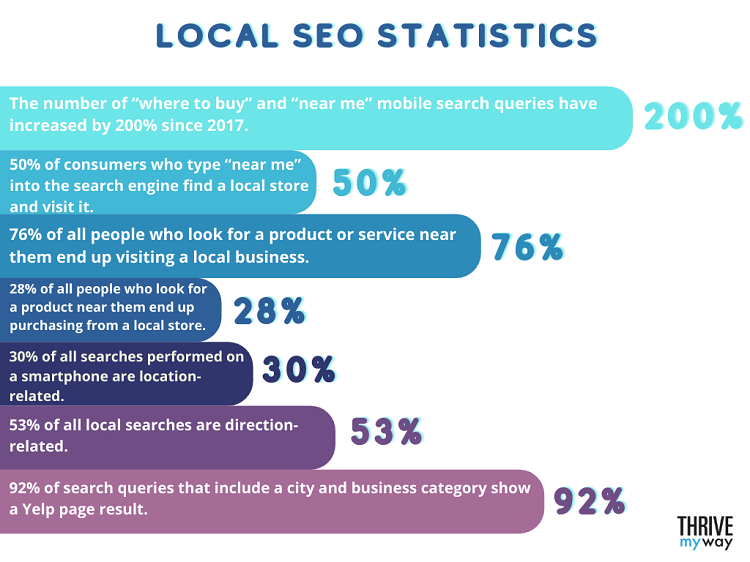
- The number of “where to buy” and “near me” mobile search queries has increased by 200% since 2017.
- 50% of consumers who type “near me” into the search engine find a local store and visit it.
- 76% of all people who look for a product or service near them end up visiting a local business.
- 28% of all people who look for a product or service near them end up purchasing something from a local business.
- 30% of all searches performed on a smartphone are location-related.
- 53% of all local searches are direction-related.
- 92% of search queries that include a city and business category show a Yelp page result.
E-commerce SEO Statistics
At the moment, there are over 24 million online shops. Therefore, a solid SEO strategy is a must for every e-commerce business willing to become more visible to online consumers. Below, we present the most relevant e-commerce SEO statistics, demonstrating what SEO looks like in the e-commerce industry.
- Search engines are responsible for driving ten times more traffic to eCommerce websites than social media.
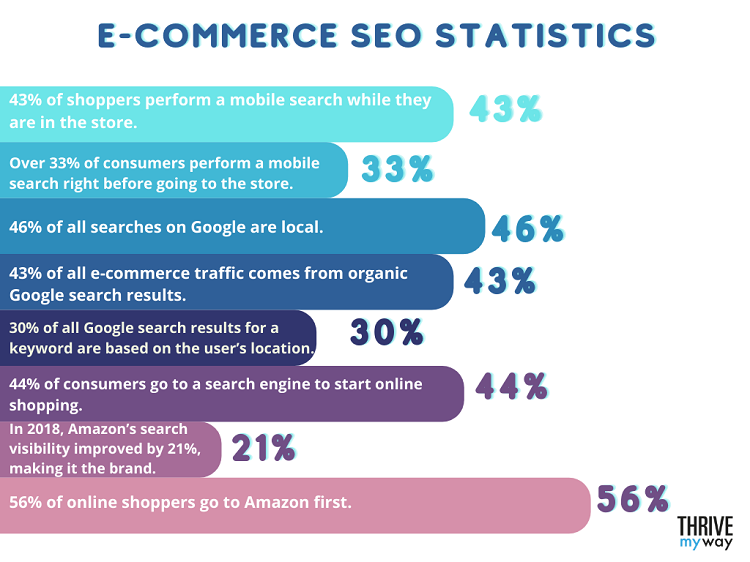
- 43% of shoppers perform a mobile search while they are in the store.
- Over 33% of consumers perform a mobile search right before going to the store.
- 46% of all searches on Google are local.
- 43% of all e-commerce traffic comes from organic Google search results.
- 30% of all Google search results for a keyword are based on the user’s location.
- 44% of consumers go to a search engine to start online shopping.
- In 2018, Amazon’s search visibility improved by 21%, making it the brand with the greatest improvement in organic Google search.
- 56% of online shoppers go to Amazon first.
SEO vs. PPC Statistics
While 70% of marketers prefer SEO strategies to pay-per-click (PPC) ads, Google Ads help significantly raise brand awareness and result in faster business growth. Here are some mind-blowing SEO vs. PPC statistics.
- SEO drives almost 100% more traffic than PPC.
- In 2019, the average PPC cost was $1.03.
- In 2019, the average click-through rate of a PPC ad search result was 1.8%.
- 70% of digital marketers prefer SEO to PPC as a sales-generating strategy.
- Between 70 and 80% of people ignore Google’s sponsored ads.
- People who visit a website from paid ads are more likely to buy than people seeing it from an organic search.
- Only 30% of people click on sponsored Google ads results.
- 77% of people can recognize a paid search ad.
- AdBlock is used by over 763 million devices worldwide.
- Even though most people won’t click on them, PPC ads boost brand awareness by 80%.
- The insurance industry has the highest monthly CPC (cost-per-click) in Google search ads at $18.57.
- The electronics industry has the lowest monthly CPC (cost-per-click) in Google search ads at $0.83.
- PPC ads are not affected by Google’s frequent algorithm changes.
Different Search Engine Statistics
Out of all the different search engines that exist globally, Google and Bing are the most popular ones. So let’s take a look at their statistics.
Google Statistics
- 92.05% of all search engine users in the world use Google.
- In the United States, Google dominates the search engine market, with over 87% of the search engine market share.
- 93.24% of all search engine users in Europe use Google.
- Google has the least users in Asia (91.6%) and the most users in South America (97.14%).
- In 2020, over 95% of all mobile searches in the world were made using Google.
- An average Internet user searches Google 4 times per day.
- As of 2021, there are over 63,000 Google searches per second
- There are over 7 billion Google searches per day (around 2.5 trillion searches a year).
- Approximately 3.8 million Google searches are performed every minute.
- The pages ranking first in Google have a click-through rate of 34.36%.
- The pages ranking first in Google searches have an average of 1,447 words.
- 20% of all Google queries are first-time searches, which means that no one has used them before.
- Google algorithm uses over 200 different factors to rank websites.
- The number of zero-click Google searches has grown from 50% in 2019 to 64.82% in 2021.
- Backlinks are one of Google’s favorite ranking factors.
- Over 99% of featured pages already rank in positions 1 through 10 on Google.
- In 2019, Google’s revenue was estimated at over $160 billion.
- In 2019, Google ads revenue was estimated at over $134 billion.
- In 2020, Google ads revenue increased by 38%.
- 14.6% of Google website referrals end in a purchase.
- 90% of Google users prefer organic results to PPC ad results.
- On average, users spend less than a minute on the Google search results page.
Bing Statistics
- In 2020, Bing held over 7% of the search engine market share in the United States.
- In 2020, Bing held only 3% of the total search engine market share in Europe.
- In 2020, less than 2% of all mobile searches in the world were made using Bing.
- In February 2021, Bing had over 936 million monthly users worldwide, both on mobile and desktop.
- As of 2021, Bing holds the 32nd position in the world’s top 500 websites ranking.
- As of 2021, Bing ranks as the 24th website with the biggest traffic in the US.
- As of 2021, Bing has 1,038 billion unique monthly visitors globally.
- Over 14 billion monthly desktop searches are done on Bing.
- It is estimated that Bing has over 450 million monthly active users worldwide.
- 99.8% of all Bing searches are organic.
- In the US, Bing’s mobile market share is 2.83%, tablet market share is 5.63%, and desktop market share is 13.48%.
- On average, there are 34 times more searches made on Google than on Bing.
- 73% of all Bing users are less than 45 years old.
- 56% of all Bing users are men, and 44% of all Bing users are women.
- YouTube drives over 50% of social traffic to Bing.
- On average, only 7.16% of Bing searches result in a click on one of the search results.
SEO ROI Statistics
How long does it take to see ROI from SEO and content marketing? To help you find the answer to this question, let’s take a look at the latest SEO ROI statistics.
- Google Ads have an average of 200% ROI.
- The financial services industry has the highest average SEO ROI of 1,389%.
- The e-commerce industry has the lowest average SEO ROI of 317%.
- Standard content marketing has an average of 16% ROI.
- Technical SEO has an average of 117% ROI.
- Thought leadership marketing SEO efforts get an average ROI of 748%.
- For businesses looking to maximize these returns, opting for a reliable SEO service online can be a strategic investment.
- Ranking 3rd in Google search results can increase your click rate to approximately 852%.
- Ranking 5th in Google search results can increase your click rate to approximately 313%.
- The average ROI of SEO is $22.24 for every $1 spent.
You might be interested to check those related posts as well:
- 20+ Stats About Backlinks and Link Building [2023]
- 15 Useful SEO Ranking Factors 2024 [Learn Digital Marketing]
- Creating the Best SEO Strategy in 2024 [Detailed Guide]
Interesting SEO Facts
Before we end this article, here are some of the most interesting SEO facts that everyone should know.
- The first search engine was launched in 1993 under the name Archie Query Form.
- In 1996, Ask.com was launched.
- Google was launched in 1998.
- In 2012, it took one minute for Google to crawl 50 million websites, compared to one month in 1999.
- The Google search algorithm undergoes between 500 to 600 changes every single year.
- An average internet user makes over 100 searches per year.
- The most searched keyword on Google is YouTube.
- Yahoo Search was launched in 2002.
- Baidu is the most popular Chinese search engine.
- Yandex is the most popular Russian search engine.
SEO trends change almost daily. The search engine optimization market is on the rise, with more and more brands and companies competing to rank on the first page of Google.
As a digital marketer or an online business owner, nailing down your SEO strategies can result in massive business growth. Understanding the key SEO statistics and facts will help you improve your SEO and rank higher on Google.
The data collected in this article has been gathered from various sources, such as Statista, Finances Online, Hubspot, Backlinko, Zupo, and more.