The speed of how long your website takes to load can be an important factor. These site speed stats prove how vital site speed is for conversions, ranking, and more.
Read below to find out more.
Key Site Speed Stats 2024
- Only the top 20% of websites have a server response time of less than 312ms.
- 91% of digital minutes in Indonesia are on a mobile device.
- Only 15% of websites are considered to have acceptable loading times.
- 46% of websites load between six and ten seconds to load, which is double what Google recommends for website loading times.
- Larger website pages will take 381% longer to load than smaller pages.
Average Website Load Time Statistics
- The fastest loading times in the world can be found in China, Japan, and Germany.
- The slowest loading times in the world can be found in Australia, India, and Brazil.
- 50.6% of customers will blame their internet connection before they will blame the website for poor loading times.
- 45% of 18 to 24-year-olds say they are willing to wait up to six seconds before they will abandon a website.
Average Page Load Time by Device: Mobile vs. Desktop
- The average page loading time for desktops is 10.3 seconds compared to 27.3 seconds on mobile devices.
- Mobile minutes account for 77% of online time in the US in 2019.
- Customers think they are more patient about website loading times than they really are.
- 85% of mobile users expect that the websites they use should load at the same rate or faster than when they are using desktops.
- 64% of smartphone users expect a mobile website should load within four seconds.
- Most websites still have slower loading times on mobile devices because there are too many elements on the website page.
- The average website takes 87.84% longer to load on a mobile device than on a desktop.
- Page size is more important on mobile devices than it is on desktop devices.
Average Page Load Time by Industry Statistics
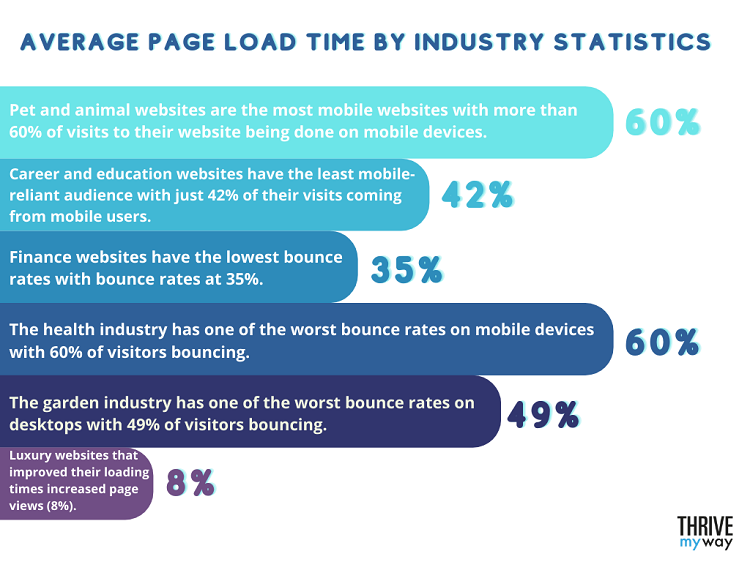
- Pet and animal websites are the most mobile websites with more than 60% of visits to their website being done on mobile devices.
- Career and education websites have the least mobile-reliant audience, with just 42% of their visits coming from mobile users.
- Finance websites have the lowest bounce rates, with bounce rates at 35% for mobile and 18% for desktops.
- The health industry has one of the worst bounce rates on mobile devices, with 60% of visitors bouncing.
- The garden industry has one of the worst bounce rates on desktops, with 49% of visitors bouncing.
- Technology websites have the longest loading times, with the average loading time being 11.3 seconds.
- Classified and listing websites have the shortest loading times with the average time being 7.9 seconds.
- Luxury websites that improved their loading times by 0.1 seconds say the number of pages visited on their website via mobile devices increased by 8%.
Average Page Load Time last 2021
- The average mobile website page takes about 15.3 seconds to load in 2021. In 2017, Google conducted a survey that found the average mobile website page took 22 seconds to load.
- The average page loading time for desktops is 10.3 seconds.
- The Time to First Byte speed is, on average, 1.286 seconds on a desktop device and it is 2.594 seconds on mobile devices.
Google Site Speed Statistics
- The optimal request count, which is the number of content pieces required for the website page to display, is considered to be fewer than 50.
- Google has stated that by compressing website images and text, about a quarter of pages could save 250KB, and 10% of website pages could save 1MB or more. This can improve loading times significantly.
- Google will lose 20% of its traffic for every 100ms that it takes for one of its pages to load.
Average Load Time of WordPress Sites
- WordPress has one of the lowest page loading times for mobile devices. Usually, website owners do not optimize their websites properly for mobile devices.
- 25.3% of WordPress websites are considered to perform higher than average for desktop devices.
- 38.5% of WordPress websites are considered to perform significantly worse than average for desktop devices.
- 24.2% of WordPress websites are considered to perform faster than the average website for mobile devices.
- 40.7% of WordPress websites perform slower than the average website on mobile devices.
Website Load Time Impact Statistics
- A 0.1-second improvement in your website’s speed on mobile devices can improve conversions by 8.4%.
- A one-page loading delay can reduce page views on a website by 11%.
- 44% of customers will share the story of a long loading time with their friends and family which can reduce direct visits to your website.
- Each third-party script that is added to a website will slow down a website’s loading time by approximately 34.1 ms.
- A Content Delivery Network has the biggest impact when it comes to reducing the loading times of a website across desktops and mobiles.
- Yahoo improved its website speed by 400% and saw a 9% increase in its traffic.
- Etsy added 160kb to their mobile website and saw a 12% increase in its bounce rate.
The Effect of Load Time on Customer Loyalty
- Nearly half of all customers (46%) will never visit a website again if they’ve experienced poor loading times in the past.
- A one-second delay in loading can impact customer satisfaction by 16%.
- 64% of customers who’ve had a bad experience will never shop with a brand again.
- At least 60% of mobile users have reported at least one problem using mobile devices within the past 12 months. The most common problems experienced by customers include: too slow (74%), crashing, frozen, or errors (51%), formatting issues (48%), didn’t function as expected (45%), and not being available (38%).
- Customers remember that checkout times are 35% longer than they actually are.
- 14% of customers will start shopping on a new website if they have to wait too long for a page to load.
- The website’s loading speed is an important factor for 46% of customers who will not return to a website if the loading time is too slow.
- Half of the customers would be willing to give up animation and videos if it would result in faster loading times.
- 82% of customers from New York say that they are influenced by the speed of a website on whether they will make a purchase. This is compared to just 60% of consumers from California.
- Only 24% of marketers believe that their management team properly manages the lifetime value of their customers.
The Effect of Load Time on SEO
- Bounce rates will increase by 32% when loading times are increased from 1 to 3 seconds.
- Bounce rates will increase by 90% when a website’s loading time increases from one to five seconds.
- The chance of a customer abandoning a website can increase by 123% when the loading of a website increases from one to ten seconds.
- A customer will visit 8.9 pages when the loading time on a website is less than two seconds but will only visit 3.3 pages when the loading time is about 8 seconds.
Google has rated only 1% of eCommerce stores as excellent for page loading within the UK during 2018. - Studies have shown that the average page loading speed for websites ranked on the first page of Google results is 1.65 seconds.
- Three-quarters of the SEO user experience signals are linked to your website’s page speed.
The Effect of Load Time on Conversion Rate
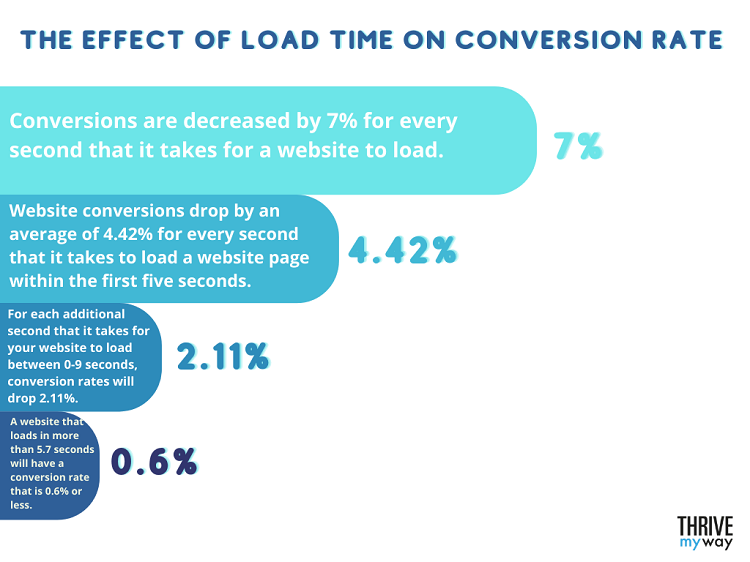
- Conversions are decreased by 7% for every second that it takes for a website to load.
- The first five seconds of loading time have the greatest impact on conversion rates.
- Website conversions drop by an average of 4.42% for every second that it takes to load a website page within the first five seconds.
- The highest eCommerce conversion rate will occur on websites that can get their pages to load within two seconds.
- For each additional second that it takes for your website to load between 0-9 seconds, conversion rates will drop 2.11%.
- A website that loads in more than 5.7 seconds will have a conversion rate that is 0.6% or less.
The Effect of Load Time on Checkout Rate
- 18% of customers will abandon a cart if the checkout page is too slow.
- $18 billion is lost in abandoned carts which can be related to loading times.
- 51% of US customers have stated that they’ve abandoned a cart on a website because the website was too slow.
The Effect of Load Time on Bounce Rate
- One in four customers will abandon a website that takes more than four seconds to load.
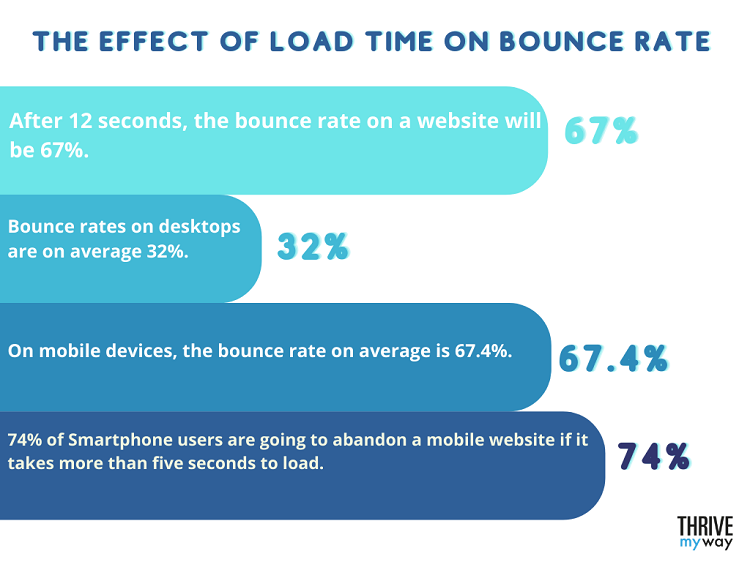
- After 12 seconds, the bounce rate on a website will be 67%.
- Bounce rates on desktops are on average 32%.
- On mobile devices, the bounce rate on average is 67.4%.
- 74% of Smartphone users are going to abandon a mobile website if it takes more than five seconds to load.
Website Speed for Businesses Statistics
- Customer stress is increased by 33% when a website takes longer than 6 seconds to load. This is equivalent to taking a test, a person watching a horror movie on their own, and is higher than waiting in a long queue at a physical store.
- The media page size doubled between 2015 and 2019.
- Squarespace and Weebly have the fastest loading times of any Content Management System (CMS) on the market.
- Wix has one of the poorest mobile loading times of all CMS.
The Effect of Load Time on Revenue
- A website that has a one-second delay in loading that has revenues of $100,000 a day can lose 79. $2.5 million in a year in revenues.
- A 0.1-second improvement in your mobile website’s speed can improve revenues by 9.2%.
- Amazon would lose $1.6 billion a year for a one-second delay in their website’s loading time.
- Walmart saw a 2% increase in revenue for every second that they improved their website’s loading time.
- ALDO found that on single-page apps, mobile users who had quicker rendering times would spend 75% more.
Future Importance of Site Speed Statistics
- The First Contentful Paint (FCP) will be more important in 2024 than it has been before.
- Using Cloud hosting and Content Delivery Networks will become more important in 2024 and beyond as they offer better loading times for websites.
- Implementing motion designs in a website’s design will become more important as it improves website loading times as well as improves navigation across a website.
You might be interested to check those related posts as well:
- 20 Best Tips [and Techniques] How to Optimize Website Speed 2024
- 10+ Amazing CDN Stats[ Internet Traffic and Usage] 2024
- 66 Essential Landing Page Stats 2024 [Facts and Trends]
FAQ
What is a good site load speed?
Ideally, you will want a website to load within three seconds. If you’re running an eCommerce website, you should look at having your loading time less than two seconds. This will reduce bounce rates, improve conversions and increase the average order values on your website.
What is a good website response time?
A good website responsive time should respond to the request in less than 312ms. This would place your website within the best 20% of websites. A good response time not only allows you to have your website load quicker, but it can also help you rank higher on Google and other search engines.
What is page speed in SEO?
Page speed is a combination of factors that determine how responsive your website is to user requests. For instance, factors like how long until the first readable content is ready, how long until the server responds to the quest, and other items are included within the search ranking of your website.
Conclusion
The site speed of your website is really important. The above statistics show you how your revenue can be impacted by a slower website speed.