Do you dream about being a sole proprietor or starting your own business?
Breaking free from the standard 9 to 5 is something many people want to do.
Having full control over your own time and setting your own goals sounds very appealing, but it can also be very challenging, oftentimes overwhelming, and also downright complicated.
Knowing what’s going on in the small business world can be very beneficial, whether you want to run a brick-and-mortar store or an eCommerce business.
Such an understanding means you’ll be in a better position to manage your opportunities and risks, and your sole proprietorship journey will be a successful one.
If you already own your own small or large business or are making plans to start one shortly, the following 121 small business stats will help.
You’ll get the hang of how a small business works, its impact on the economy, what influences many small businesses, what entrepreneurship entails, and much more.
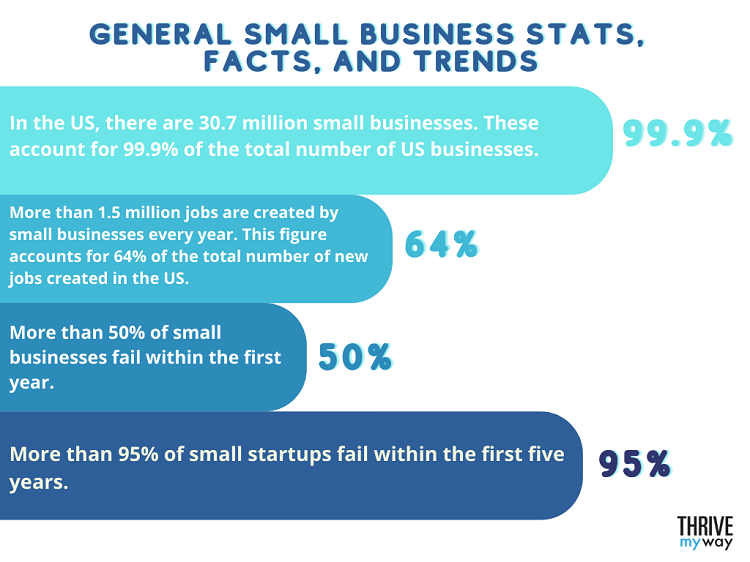
General Small Business Stats, Facts, and Trends 2024
1. In the US, there are 30.7 million small businesses. These account for 99.9% of the total number of US businesses.
2. More than 1.5 million jobs are created by small businesses every year. This figure accounts for 64% of the total number of new jobs created in the US.
3. More than 50% of small businesses fail within the first year.
4. More than 95% of small startups fail within the first five years.
5. One of the biggest challenges you’ll have to face when making a business plan is poor labor quality.
Small Business Industry Stats
6. 58% of small business owners start their new, independent business totally from scratch.
7. 18% of new business owners purchased their independent businesses from another small business owner.
8. 19% of small business owners chose to invest in a brand-new franchise location, while just 6% purchased an existing location.
9. The fastest-growing small business industries are food and restaurant (11%), business services (11%), health/beauty/fitness (10%), general retail (7%), and home services (6%).
10. There are 31.7 million small businesses and 3.7 million of them are microbusinesses with between one and nine employees.
Food and Restaurant Sector
11. 12% of small companies operate in the food and restaurant sector.
12. Consumer spending in this sector has increased steadily since 2014. In the first twelve months, the increase was 2.6%.
13. The forecasted accommodation and food service industry value in 2025 is $14.8B.
14. The restaurant industry has experienced a total sales decline from 2019 to 2020 of -19.2%.
15. The expected total sales rebound in 2021 is expected to be +10.2%.

Retail Sector
16. 11% of small companies operate in the retail sector.
17. The sector took a bit of a hit during the pandemic, with sales down 6% to $4.56B.
18. Total anticipated retail sales for 2021 should be up by 6.6% to $4.86B.
19. The forecasted value of the retail sector in 2026 is $5.52B.
Business Services
20. The COVID-19 pandemic has cost the industry dearly, with figures dropping by 16% over 2020.
21. The business services industry is currently struggling to rebound more than any other industry and can only manage a modest rate of +0.15% during 2021.
22. The total anticipated corporate profit for 2021 is expected to increase by 0.15% to $1.69B.
23. The forecasted industry value in 2025 is $2.41%.
Health, Beauty, and Fitness Services Sector
24. 9% of small businesses operate in the health, beauty, and fitness services sectors.
25. Health services are expected to experience the most dramatic rebound following the pandemic at a rate of 16.6%.
26. In the health services sector, the forecast industry value in 2026 is $4.32 trillion.
27. The forecast industry value of the beauty services sector in 2026 is $14.8 billion.
28. In the health services sector, the forecast industry revenue in 2026 is $38 million.
Residential and Commercial Services Sector
29. Residential and commercial services make up 7% of small businesses.
30. In 2019, there were 67,226 commercial and residential service franchises
31. The number of franchises increased to 68,008 in 2020.
32. The average annualized establishment growth rate between 2015 and 2019 was +1.09%.
33. The sector’s establishment growth rate increased by 1.14% between 2019 and 2020.
Small Business Owner Demographic Stats

34. Minority-owned and women-owned businesses lag far behind those owned by white men.
35. The number of women-owned businesses has exploded by 114% over the last two decades.
36. The revenue share of women-owned businesses has dropped by 0.02% during those two decades.
37. A large section of entrepreneurs has not got a college degree.
38. Businesses less likely to attract outside funding tend to be minority-owned.
Gender Small Business Statistics
39. It has been estimated that 51% of US businesses are at least 51% owned, controlled, and operated by at least one and maybe more women.
40. These businesses are responsible for employing almost 9 million people and generating $1.7 trillion in revenue.
41. Over the past 20 years, total women-owned businesses have increased by 114%.
42. 39% of US employer businesses are women-owned businesses.
43. Women-owned businesses employ a mere 8% of the total private sector workforce and are responsible for 4.2% of total business revenues.
Race Small Business Statistics
44. A 2018 US census report uncovered that only 5% of Black individuals were self-employed.
45. Minorities are far less likely to attract outside investment, which means they have to rely on family and personal savings.
46. 17.6% of black Americans have to rely on personal credit cards for their business funding.
47. The US-born labor force is represented by the following races: white small business owners 3.8%, Asians 2.5%, Hispanics 1.6%, and Black Americans 1.1%.
Age Small Business Statistics
48. The founders of startup businesses tend to be in their 40s.
49. Startup SMB owners are most likely to achieve success between the mid-30s and the age of 50.
50. After the age of 50, the likelihood of startup success declines.
Degree in Small Business Statistics
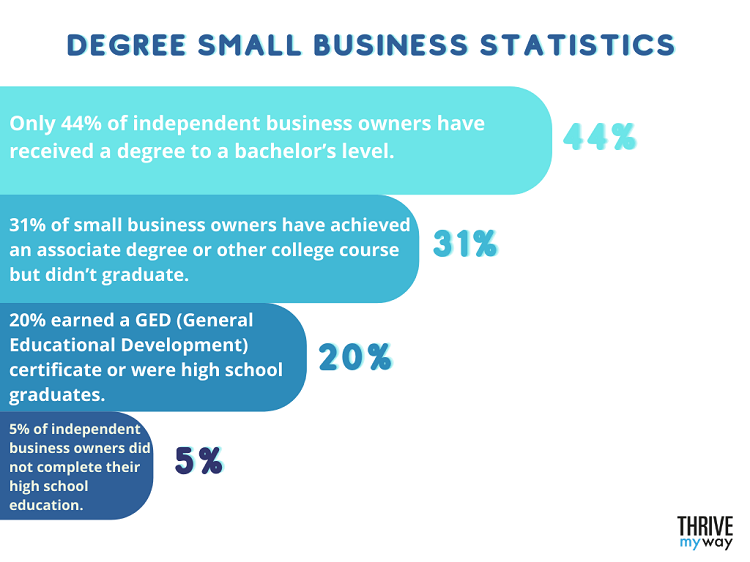
51. Only 44% of independent business owners have received a degree to a bachelor’s level.
52. 31% of small business owners have achieved an associate degree or other college course but didn’t graduate.
53. 20% earned a GED (General Educational Development) certificate or were high school graduates.
54. 5% of independent business owners did not complete their high school education.
55. Research has found that a successful entrepreneur tends to be male, white, better-educated, and from two-parent, high-earning backgrounds.
Income Small Business Statistics
56. Small businesses with no employees average $46,978 in annual revenue.
57. On average, the small business owner makes $71,813 annually.
58. The income of 86.3% of small business owners is less than $100,000 per year.
59. In 2007, women’s small business owners averaged $130,000 in revenue, compared to male small business owners that averaged $570,000, more than four times that.
60. In 2016, the number of small firms with no paid employees making between $1 million and $2.49 million in revenue increased by 1.6%.
Women-Owned Businesses Stats
61. According to a survey undertaken by the 2021 Small Business Trends Alliance (SBTA), 77% of female business owners are expecting their businesses to live on after the COVID-19 pandemic.
62. 46% of black entrepreneurs are women, one of the highest percentages of women-owned businesses of any race segment.
63. SBTA reports that the top challenges faced by female entrepreneurs that aren’t COVID related are advertising and marketing 24%, cash flow/lack of capital 17%, retention of employees/recruiting 15%, providing/managing benefits 14%, administrative tasks 13%.
64. Expected financing methods by female-owned businesses are cash 44%, ROBS 15%, family and friends 13%, SBA loan 7%, line of credit 7%, unsecured loan 5%, equipment lease 3%, and other 6%.
Minority-Owned Businesses Stats
65. Estimates are that 8 million small businesses in the US have owners from minority backgrounds.
66. 41.25% of the monitory owners are of Hispanic origin, 32.5% are African Americans, 27.75% are owned by Asians, and 3.4% by Native Americans.
67. Estimates are that minority-owned businesses are responsible for employing 8.7 million people.
68. The largest minority-owned business sector is social assistance and health care, and it makes up 37% of all minority-owned businesses.
69. Compared to white-owned businesses, minority-owned businesses receive half the amount of investments.
Small Business Employment Stats
70. Annually, 1.5 million jobs are created by small businesses.
71. 64% of all new job creations are for small businesses.
72. More than 37% of small enterprises outsource, mainly to improve efficiency.
73. When it comes to employees, 41% of small business enterprises have between two and five employees.
74. Small businesses with less than 100 employees make up the most significant share of the sector.
Small Business & Marketing Stats
75. Facebook is popular with 90 million small business owners who want to promote their services, products, or brand. Many small businesses also find creative ways to stand out using branded products and services like personalised private number plates for company vehicles, which can help build recognition and personality on the road.
76. 88% of consumers who shop online are less likely to return to a website if they have a poor experience.
77. A small business will generate 126% faster lead economic activity if they include a blog on its website. [Don’t have a blog? Learn how to start a blog]
78. When it comes to investing in marketing, 80% of small businesses have yet to appreciate the value of content marketing.
79. 75% of small companies use paid advertising, including long-term social media marketing campaigns and boosted posts.
Small Business & Social Media Stats
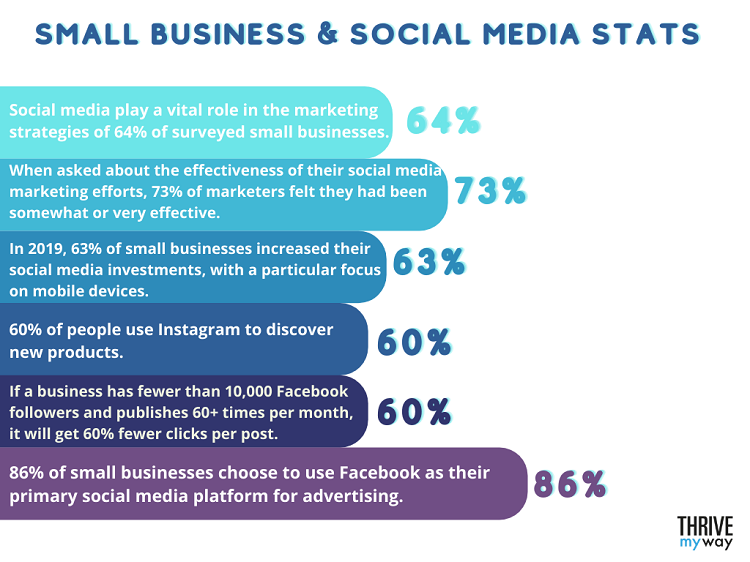
80. Social media play a vital role in the marketing strategies of 64% of surveyed small businesses.
81. When asked about the effectiveness of their social media marketing efforts, 73% of marketers felt they had been somewhat or very effective.
82. In 2019, 63% of small businesses increased their social media investments, with a particular focus on mobile devices.
83. 60% of people use Instagram to discover new products.
84. If a business has fewer than 10,000 Facebook followers and publishes 60+ times per month, it will get 60% fewer clicks per post than a business posting five times or fewer per month.
85. 86% of small businesses choose to use Facebook as their primary social media platform for advertising.
Small Business Financial Stats
86. In 2020, a credit growth rate of 14% was reported.
87. When starting a business, 39% of new owners use cash rather than alternative lenders.
88. Cash flow is the biggest challenge for a small business owner.
90. Overall, the average loan amount is $107,000.
91. 9 million loans were handed out to SMEs at the end of 2020, and they amounted to a total of $750 billion.
92. Investing in quality payroll software helps small businesses with staff stay compliant and minimises time spent on administration tasks.
Small Business Revenue Statistics
93. 28% of small business owners say that cash flow is their biggest challenge.
94. Estimates are that the average effective tax rate paid by small businesses is 19.8%.
95. In 2017, small businesses accounted for 97% of importers and 98% of exporters.
96. In a survey by Guidant Financial and Lending Club, 78% of small business owners considered their business to be a profitable one.
97. The small business’ share of the US GDP dropped between 1998 and 2014, from 48% to 43.5%.
Small Business Lending Statistics
98. To get their business off the ground, 56% of small business entrepreneurs use their own savings or get loans from friends or family, even if they’ve got a good credit score.
99. Major capital expansion sources are profits/assets, bank loans, credit cards, and home equity.
100. The default rates for small businesses are at an all-time low currently, of less than 2%.
101. Small businesses commonly use a small business loan for financing fixed assets or equipment.
102. When new entrepreneurs in the US complete business applications for venture capital funding, only 0.7% are successful.
Small Business Technology Stats
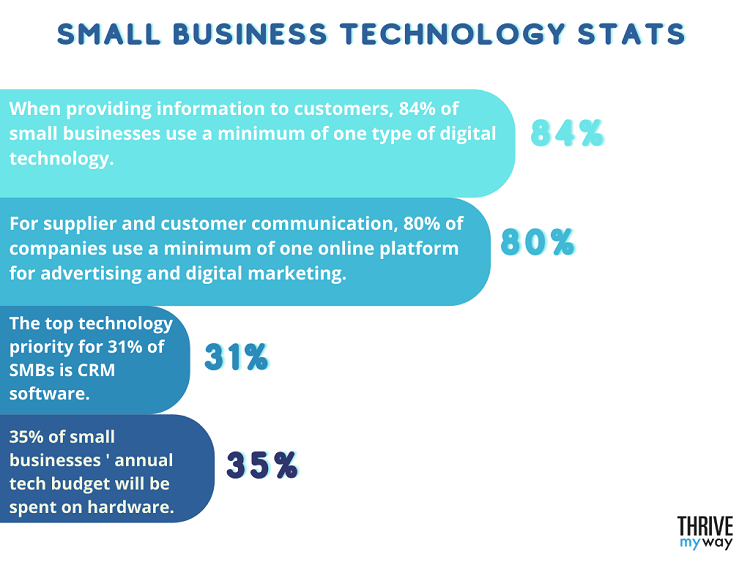
103. When providing information to customers, 84% of small businesses use a minimum of one type of digital technology.
104. For supplier and customer communication, 80% of companies use a minimum of one online platform for advertising and digital marketing.
105. Digital platforms are used by three-quarters of small businesses.
106. The top technology priority for 31% of SMBs is CRM software, with financial software coming in second, followed by technology services.
107. 35% of small businesses ‘ annual tech budget will be spent on hardware.
COVID-19 Impact on Small Businesses

108. In 2020, 27% of a small business’s workforce had to be laid off or furloughed.
109. During the pandemic, 29% of small businesses have been able to keep all their employees.
110. A negative effect was felt by 83.5% of businesses in the food services and accommodation sectors because of the COVID-19 pandemic.
111. Federal government relief will be critical to the recovery and success of 4% of small business owners.
112. 56% of small business owners think that it could take a minimum of six months, possibly as long as a year, for the business climate and economy to recover and return to normal.
Small Business Growth and Survival Stats
113. You can increase your chance of success if your small business has two founders, one business developer, and one technical, compared with one owner.
114. A small business founder is more likely to be successful if they have previously failed.
115. Selling a service rather than a product means your business is less likely to fail.
116. A business that prioritizes investments in technology is more likely to succeed.
117. According to the National Small Business Association (NSBA), small business owners feel increasingly more optimistic.
Small Business Failure Stats
118. Poor financial management can be a killer for small businesses, with 82% failing because of cash flow problems.
119. Around 543,000 new businesses are started every month.
120. In the first year of running a small business, the failure rate is 20%.
121. The failure rate decreases after two years to one-third, and it’s 50% after five years.
122. The second most common reason for a small business to fail is that there is no market for its services or products.
You might be interested to check those related posts as well:
- 42 Mind-Boggling Branding Statistics and Facts 2024
- 20+ Stats About Backlinks and Link Building [2023]
- 110 Important Online Business Stats 2024 [Facts and Trends]
Final Thoughts
2020 and 2021 have been a couple of eventful years for businesses around the world.
Things have been very rocky for some time now, but thankfully, data and statistics are judgemental at all and just tell it how it is.
With the right kind of data at your fingertips, you’re better placed to make the best decisions and those that are right for you.
The key to interpreting it correctly is understanding how it shapes your business choices and using it to your advantage when making plans, starting, or growing your small business.
The stats in this article were gathered from the following sources:
OBERLO, FitsSmallBusiness, Fundera, Fool, Gosite, Fit Small Business, SEMRush, FinancesOnline, Fortunly.