
Mobile apps have become an integral part of how we live our lives today.
They can give us access to a world of music and movies, help us meet a new romantic partner, and manage our diaries, payments, and documentation.
The latest mobile app advancement is augmented reality apps, and they are changing the way we interact with the world.
In addition, mobile gaming apps now have the lion’s share of the games industry’s revenue.
During the coronavirus pandemic, apps have also had a part to play in helping to facilitate social distancing and contact tracing.
They’ve also been instrumental in allowing us to keep in touch with distant family, friends, and colleagues.
If you’d like to learn more about the world of mobile apps and the opportunities in the industry, check out these mobile app stats.
Mobile App Download Stats in 2024
- In 2020, 142.9 billion apps and games were downloaded.
- 86.7 billion of those downloads were apps, and 56.1 billion were mobile games.
- Consumers are expected to download 258.2 billion mobile apps in 2024.
Global Downloads
- Global app downloads across the Apple App Store and Google Play Store exceeded 113 billion in 2018, which was an increase of 10% from the previous year.
- Worldwide, the most popular apps among users are Facebook (81%), YouTube (71%), and Facebook Messenger (68%) across mobile and desktop devices.
- 46% of users have the Facebook App on their home screens.
Free vs. Paid Downloads
- 98% of app revenue worldwide comes from free apps.
- The vast majority of apps available on the Apple App Store and Google Play Store are offered for free.
Google Play Store vs. App Store Downloads
- In 2020, the Google Play Store was responsible for 108.5 billion downloads.
- In the same year, the iOS Apple store had 34.4 billion downloads.
- Between 2020 and 2021, Google Play Store downloads grew by 31%.
- During the same time period, the Apple App Store downloads grew by just 2.5%.
Top App Store Categories
- 21.49% of apps on the Apple App Store are games.
Top Google Play Store App Categories
- The Google Play Store has almost 3 million apps available for download.
- The top 10 most popular Google Play Store App categories are as follows:
- Tools — 99.81%
- Communication — 99.93%
- Business — 99.33%
- Video Players & Edit— 96.63%
- Travel & Local — 95.7%
- Social — 95.02%
- Productivity — 91.67%
- Music & Audio — 88.38%
- Entertainment — 83.85%
- News & Magazines — 81.11%
Most-Downloaded Apps
- TikTok was the most downloaded non-gaming app, with more than 115.2 million installs in March 2020.
- Facebook Messenger is the top mobile application worldwide by download.
- Google owns the majority of mobile apps on the market today, including Maps, Hangouts, and YouTube.
Mobile Usage Statistics 2024

- 88% of the time people spend on their mobile devices is spent on apps.
- Almost 50% of people open at least one of the apps on their phone more than 11 times a day.
- 69% of all US digital media time comes from mobile apps.
- The average smartphone owner uses ten apps per day and 30 apps each month.
- In 2020, the average mobile user had 40 apps installed on their mobile phone.
- Music apps are launched more daily than any other category of apps, with users launching them nearly three times per day, on average.
- An increasing number of people are using their mobile and desktop devices to make phone calls using apps from mobile virtual network operators. Last year the MVNO market was valued at USD $61.9 billion and it’s expected to reach USD 91.63 billion over the next five years.
Mobile App Retention
- 71% of app users will stop using the app within the first 90 days of downloading an app.
Most Essential Apps
- In the US, the share of people that feel they could least do without the following apps are:
- Facebook 17%
- Instagram 13%
- Gmail 9%
- YouTube 8%
- Twitter 7%
- Chrome 6%
- Maps 6%
- WhatsApp 5%
- Amazon 5%
- Messenger 5%
Mobile App Usage by Age
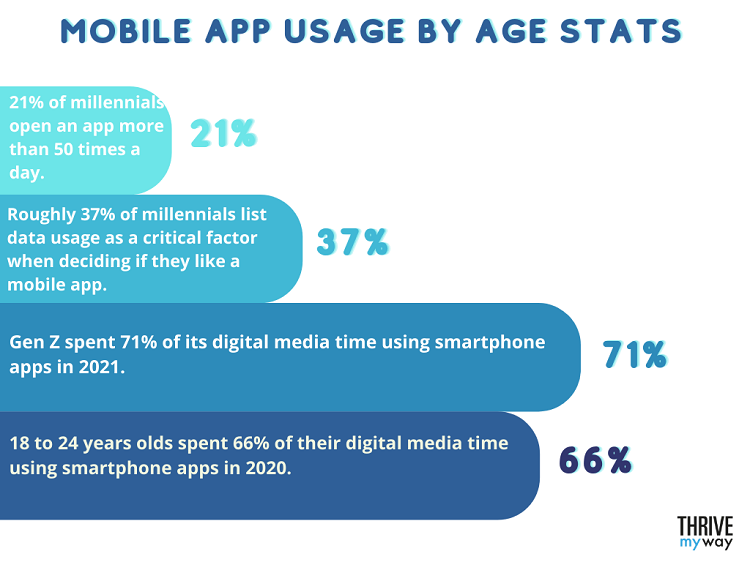
- 21% of millennials open an app more than 50 times a day.
- Roughly 37% of millennials list data usage as a critical factor when deciding if they like a mobile app.
- Gen Z spent 71% of its digital media time using smartphone apps in 2021.
- 18 to 24 years olds spent 66% of their digital media time using smartphone apps in 2020.
Mobile App Usage Statistics by Device
- Smartphone users spend 50% of their mobile app time in social and communications apps.
Mobile App Usage Statistics by Country
- Between 2016 and 2019, the number of app downloads in China grew by 80%.
- India’s app download growth rate for the same time period is 190%.
- In the United States, it was just 5%.
Monthly App Usage
- WhatsApp is the top mobile app worldwide by monthly active users.
- The average monthly hours per mobile app user by age are as follows:
- Ages 18-24: 112.6 hours
- Ages 25-34: 102.4 hours
- Ages 35-44: 93.6 hours
- Ages 45-54: 75.5 hours
- Ages 55-64: 69.3 hours
- Ages 65+: 51.4 hours
Time of App Usage
- Usually, people spend the most time on social media apps. Let’s look at some of the other figures for the total time spent per week in minutes:
- Social media – 131
- Gaming – 116
- Communication – 103
- Music – 80
- Entertainment – 67
- Retail and Ecommerce – 65
- Finance – 57
- Mobile browser – 46
- Productivity – 35
- Health and wellness – 27
- Maps – 25
- Travel – 19
- Others – 42
Android App Statistics
- As of August 2021, 96.9% of Android apps are available for free on the Google Play Store.
- There are 2.8+ billion Android users.
- Android holds a global market share of 75%.
- On average, more than 100,000 new Android apps are released in the Google Play Store every month.
iPhone App Usage Stats
- The Apple App Store has almost 2 million apps available for download.
- Every week, approximately 500+ million users visit the iOS App Store.
- Around 30,000+ new iOS apps are released on the Apple App Store every month.
App Usage: During and After Coronavirus
- Since the COVID-19 pandemic, mobile app downloads are up by 23.3%, specifically in the work-from-home, food delivery, and fitness segments.
- During the global outbreak of the coronavirus pandemic, engagement with mobile apps skyrocketed.
- With the onset of the coronavirus, Zoom suddenly supported more than 200 million daily meeting participants, up from 10 million in December 2019.
- Netflix saw a 55% increase in app downloads at the end of March 2020.
- For the first quarter of 2020, Netflix reported over 59 million installs.
In-App Advertising Statistics
- Total mobile ad spending in 2018 was more than $70 billion in the US and almost $184 billion worldwide.
- Between 2017 and 2018, mobile ad spending grew by around 20%.
- In one Ipsos survey, half of the respondents said they thought mobile ads were visually appealing, while 44% said the same thing about desktop and laptop browser ads.
- In 2020, global spending on mobile marketing reached $276 billion.
- In the US alone during the same period, mobile advertising spending reached $113 billion.
- Facebook’s advertising revenue amounted to $84 billion in 2020.
- Google advertising revenue stacked up to $147 billion in the same year.
Mobile App Revenue Statistics
- Mobile apps are expected to generate more than $935 billion in in-app revenue by 2024.
- The gaming mobile app market will make $102.8 billion by 2024.
- Apps in the Apple App Store brought in nearly double the revenue of those in the Google Play Store.
- Apps with subscriptions account for the majority of consumer spending in the top non-gaming apps.
- Consumers spend the most on video apps.
Mobile App Industry Statistics

Banking And FinTech
- In 2020, mobile banking and fintech apps were downloaded 4.6 billion times worldwide which is a growth rate of 15% compared to 2019.
- In 2020, at least one fintech app was used by 64% of the US adult population.
- Among Gen X, more than 90% are enthusiastic about mobile banking and fintech apps.
Food, Restaurants, and Quick Service Restaurants
- In 2020, food and drink delivery apps were downloaded 400 million times, which is a growth rate of 20% compared to 2019.
Travel
- In Q2, 2021, 10.6 million travel apps were downloaded, which is a jump of 81% compared to the same period in 2019.
Health And Fitness
- In 2019, 68.7 million smartphone owners in the US used at least one health and fitness app at least once per month.
- In 2020, the number of US health and fitness app users was 87.4 million.
- In 2019, consumers spent 130% more on health and fitness apps than they did in 2017.
Retail
- In the US, mobile shopping grew by 70% between 2018 and 2019.
- After shopping online, a smartphone user opens a retail app (23.3%) or a communication/social app (18.9%), which indicates that the shopper is either going to continue shopping or tell their friends about their purchase.
Entertainment
- 55% of people who use entertainment apps use them while relaxing.
Online Dating
- In 2020, 270 million adults used dating apps worldwide, which is almost double the number five years ago.
- In the US alone, 39% of couples in 2019 said they met online.
- Badoo is the most downloaded dating app in the world, with over 400 million registered users.
- In 2020, the total revenue from dating apps was $1.69 billion.
Mobile App User Engagement Statistics
- One in two apps is uninstalled within the first month after being downloaded, with “not in use” being the top reason users uninstall a mobile app.
- 90% of users who engage with an app – even once a week – tend to stick around.
- In March 2020, the total worldwide mobile app sessions spiked at 8%, while retention after 30 days from the first install recorded its lowest rate.
- Mobile ads are a way to generate income from apps, but size matters. For example, the most popular and best-performing size for your mobile ads is 300 x 250.
Mobile App Development Statistics
- 69% of customers are likely to buy from apps or mobile websites offering personalized recommendations.
- 39% of users prefer shipping on an app because it gives them better deals and is faster.
- The five biggest category gainers in the mobile app industry in 2020 were: business (275% growth), finance (200% growth), education (200% growth), food delivery (105% growth), fitness (30% growth).
- Around 94% of cybersecurity and IT experts expect cyberattacks to increase.
- Nearly 90% of users want a voice assistant option in their apps by 2024.
- 70% of users will abandon your app if it makes them wait too long.
- 50% of people admit that a good app builds brand credibility.
- In 2016, the number of mobile app publishers in the world was 12 million.
You might be interested to check those related posts as well:
- 30+ Fascinating TikTok User Stats 2024 [Facts and Trends]
- 27+ Amazing iPhone Stats [Facts and Trends to Know] 2024
- 40+ Amazing Zoom User Stats 2024 [Facts and Trends]
FAQ
What percentage of mobile apps are successful?
Only 0.5% of consumer mobile apps are successful.
What percentage of apps make money?
According to Gartner, less than 0.01% of all consumer mobile apps will become financially successful.
How much data does the average person use per month?
The average smartphone owner uses between 2GB and 5GB of data each month.
Final Thoughts
Mobile apps have become ingrained in our daily lives, and in 2024, the mobile app industry will continue to grow.
If you’re already a mobile app developer or are planning to build a mobile app, the fact that mobile usage and penetration are at an all-time high is bound to be encouraging news.
However, alongside developing and managing an app, you also have to stay updated on the latest research and trends.
Use these mobile app statistics as a reference to help you better understand the mobile app industry.
We’d like to thank the following resources for helping us compile the list:
- Buildfire
- Statista
- Business of Apps
- Clear Bridge Mobile
- Techjury
- Emizentech
- MindSea
- SimForm
- WebsiteBuilder
- InMobi
- FinancesOnline
- Bugsnag
- Adjust
- Sphinx Solution