
In a world where the COVID-19 pandemic has upended so many things, companies have turned to digital experiences to engage audiences and consumers across the globe.
With virtual events looking to exceed $400 billion by 2027, you might be wondering whether it’s worth jumping on board and developing your own event strategy.
While some virtual attendees and businesses might be awaiting the return of the physical event, it seems like virtual events are here to stay.
After all, they offer many opportunities for both large and small businesses.
In this post, the focus will be on virtual events and the benefits they can bring to your business.
Key Virtual Event Stats 2024
- One-fifth of trade shows were being organized as digital events in the last year.
- In 2021, almost one-third of trade shows worldwide were staged as hybrid events.
- 45.9% of people attend ten or more online events compared to 12.6% who participate in in-person events.
- 97% of event organizers believe we will see more hybrid events in 2021.
- 89% of event technology businesses say it saves roughly 200 hours per year.
Virtual Event Preparation Statistics
- It takes between three and six weeks to prepare, organize, and promote a small virtual event.
Virtual Event Promotion Statistics
- 60% of virtual event organizers use social media to drive registrations.
- According to 76% of marketers, email is the most effective way to drive registrations.
- 51% of B2B companies use business partners to drive registrations.
Virtual Event Success and Challenges Statistics
- 70% of event organizers consider good microphones critical to the event’s success.
- The top three challenges for event organizers are planning the event, deciding whether to cancel, postpone, or shift to a virtual event, and changing contracts and terms with suppliers, exhibitors, and investors.
Virtual Event Audience Engagement Statistics

- In a 2020 survey, around 50% of large event organizers worldwide said they used engagement (total registration and attendee numbers) to gauge how effective a virtual event has been.
- Audience engagement is a significant concern for B2B event marketers, followed by interaction.
- 89% of virtual event planners use social media as an engagement tool before the event.
- Top engagement techniques include Q & A sessions and getting them to discuss and share.
- Hosting live hangouts before or after an event is the most successful virtual event engagement technique.
Virtual Event Financial Statistics
- The pricing of hybrid events is considered the main financial challenge among three out of ten business event suppliers and planners worldwide.
- Many companies allocate around 10% to 20% of their marketing budget to online events.
- The virtual platform takes up the biggest portion of a virtual event budget, followed by speaker and moderator costs.
Virtual Event Investment Statistics
- 33.7% of marketers say that the average going rate for the event as a whole is between $500 and $1,000 per virtual event attendee.
- When working out the cost of executing a virtual event, remember to factor in the hidden costs associated, including people, work, and opportunity costs.
Event Sponsorship Statistics
- 50.6% of respondents think that tools to connect sponsors and attendees in person and virtually will play a key role in their virtual event strategies.
- One-third of respondents allocate 21% or more of their event marketing budget towards sponsoring or exhibiting at events.
- Global sponsorship spending was up to $65.8 billion.
Event ROI Statistics
- 22% of event professionals say multi-day virtual conferences have the most significant impact on key business objectives.
- Attendee engagement and satisfaction are key performance indicators (KPIs) for event success, according to 37% of respondents.
Virtual Events Sustainability Statistics
- More than half of surveyed B2B marketers say they would prefer returning to attend in-person events rather than virtual versions.
Event Industry Statistics
B2B Event Industry Statistics

- 54% of B2B marketers within the Professional Services industry host VIP events.
- 51% host thought leadership events.
- 65% of B2B marketers plan to reallocate some or most of their live event budgets to online events, such as webinars.
Virtual Event Software and Technology Event Statistics
- When it comes to the tools used to carry out virtual events, webinars are favored by around half of the global attendees.
- 99% of polled companies agreed that webinars represent a critical element of their event marketing plan.
- 43% of respondents said they use virtual meeting software.
- One-third of businesses use an event app for their online events.
- 92% of marketers believe event management software makes it easier to achieve business outcomes.
Commercial and Professional Services Event Statistics
- 96% of respondents in the commercial and professional service industry believe events provide valuable opportunities for event attendees.
- 92% consider leadership teams to be very committed to their events strategies.
- 54% of event marketers in the professional services industry host events to drive brand awareness.
Media Event Statistics
- Within the media industry, 97% of respondents believe in-person events have a major impact on achieving business goals.
Hybrid Event Statistics
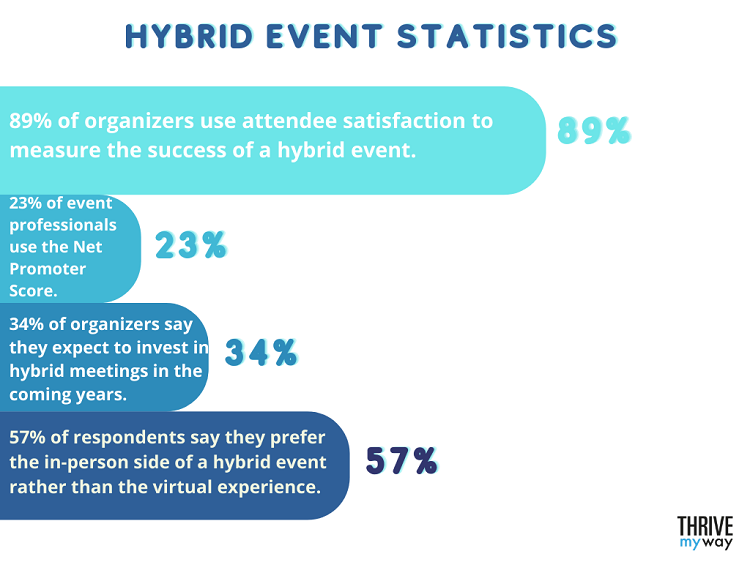
- 89% of organizers use attendee satisfaction to measure the success of a hybrid event.
- 23% of event professionals use the Net Promoter Score instead.
- 34% of organizers say they expect to invest in hybrid meetings in the coming years.
- 57% of respondents say they prefer the in-person side of a hybrid event rather than the virtual experience.
Virtual Events Forecast Statistics
- Four out of ten event professionals and exhibitors in the US are planning to increase virtual event spending in 2021.
- A survey of worldwide marketers revealed that 40% of events would be virtual in 2022, which is a 5% increase from 2021.
- The virtual events market is projected to reach $22.75 billion by 2028.
- The future of experiential marketing is looking good because 62% of senior marketers plan to invest in more future live events.
You might be interested to check those related posts as well:
- Amazing Webinar Stats 2024 [Trends, Benchmarks and Facts]
- 16 Essential Virtual Team Stats: [Working Remote] Doesn’t Mean Working Alone 2024
- 45 Amazing GoToMeeting Stats and Facts 2024 [User, Market Share, Revenue]
FAQ
What is the average no-show rate for virtual events?
The average no-show percentage of virtual events is 35%.
How long should a virtual event be?
A virtual event should last between two and four hours, but anything up to a five-hour duration works well for engagement.
What percentage of virtual event costs come from technology?
The biggest expense for a virtual event is technology, which can be as much as 75%.
What’s the market size of virtual events platform vendors?
According to Verified Market Research, the Global Virtual Events Market Platform size was valued at $9.03 billion in 2020.
Conclusion
Now you’ve got some insight into the best way to set up your virtual events. You’re probably raring to go.
There are several types of events to choose from, such as a virtual job fair, webinars, virtual event marketing summits, and even standup comedy sessions.
But one common factor is that they look set to play a significant role, both on their own and as part of a hybrid event approach.
To help compile this list of virtual event statistics, we used the following resources:
- Statista
- Eventtus
- Markletic
- LAI Live
- Drift
- Bizzabo
- Personify
- StreamGo
- Cvent
- PR Newswire