
Hiring the best candidates for roles in your company plays a crucial part in its success.
There have been many changes over the last couple of years, mainly due to the global health crisis.
In addition, new tech is bringing about changes regarding new talent acquisition methods and how prospective candidates make decisions about accepting jobs.
Improving your knowledge of hiring and recruitment should allow you to effectively align your recruitment strategies and business.
Let’s introduce the definitive list of recruitment and hiring statistics to help you get the edge over your competitors.
General Recruitment Stats 2024
- The top five most critical recruiting priorities are improving the quality of hire (52%), increasing retention rate (24%), improving time-to-hire (23%), growing the talent pipeline (22%), and diversity hiring (22%).
- 80% of the top 100 grossing recruitment agencies operate in multiple countries.
- 8 out of 10 recruiters screen candidates by way of references.
Employer Branding and Recruiting Statistics
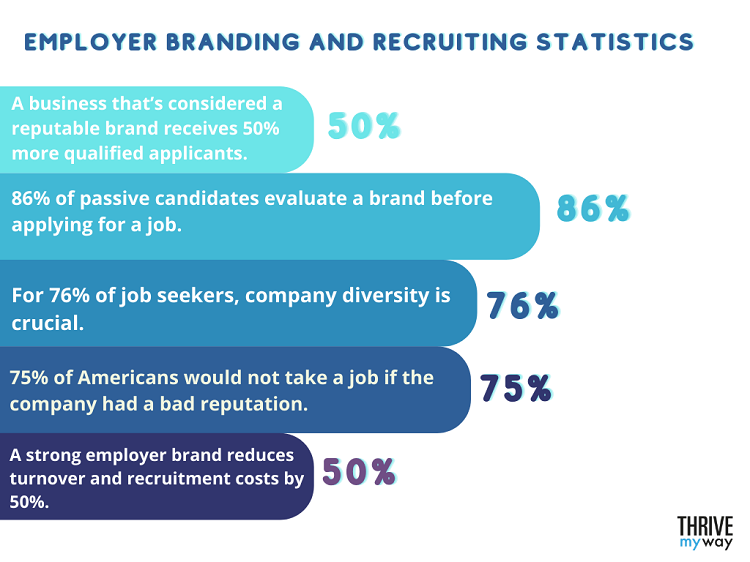
- A business that’s considered a reputable brand receives 50% more qualified applicants.
- 86% of passive candidates evaluate a brand before applying for a job.
- For 76% of job seekers, company diversity is crucial.
- 75% of Americans would not take a job if the company had a bad reputation.
- A strong employer brand reduces turnover by 28% and recruitment costs by 50%.
Team Member Onboarding Statistics
- Almost 50% of respondents said they declined a job offer because the recruitment experience was poor.
- 31% of new hires have left their new job within six months.
- 36% of recruiters allow 1 to 3 business days for candidate training.
Team Member Salary and Benefits Statistics

- Job seekers are willing to sacrifice as much as 12% of their salary in exchange for improved flexibility and training.
- The most wanted benefits are healthcare insurance (40%), vacation/paid time off (37%), performance bonus (35%), paid sick days (32%), 401k plan/retirement plan/ or pension (31%), flexible schedule (30%), and office perks (19%).
Company Culture Statistics
- 64% of hiring managers consider increased skills testing a vital part of the recruitment process.
- 84% of company recruiters say that culture fit has become a key factor when recruiting.
- One-quarter of respondents say that better company culture is the top reason for changing jobs.
- According to two-thirds of job seekers, a diverse workforce is essential when choosing a company.
- 72% of polled Americans would or may consider leaving a company for one they believe has a more inclusive culture.
Job Search Statistics
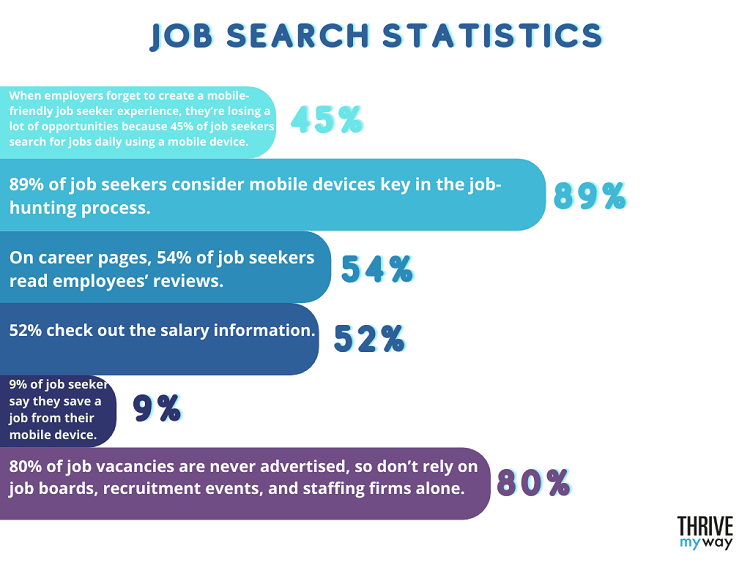
- When employers forget to create a mobile-friendly job seeker experience, they’re losing a lot of opportunities because 45% of job seekers search for jobs daily using a mobile device.
- 89% of job seekers consider mobile devices key in the job-hunting process.
- On career pages, 54% of job seekers read employees’ reviews.
- 52% check out the salary information.
- 9% of job seekers say they save a job from their mobile device and apply later on a desktop.
- 80% of job vacancies are never advertised, so don’t rely on job boards, recruitment events, and staffing firms alone.
Recruiting Process Statistics
Hiring Process Statistics
- The average time to hire across a range of platforms is 41 days.
- A rejected applicant who gets no feedback is twice as likely not to apply or do business with the company again.
- An average job posting gets 250 resumes.
- A candidate is 85 times more likely to be hired following team member referrals.
- When a team member is well-suited to their position, it positively impacts team member engagement levels.
Length of Hiring Statistics
- The average time it takes a company to hire talent is 36 working days.
- 55% of companies who recruit constantly say it cuts their time-to-hire.
- The average opening sat unfulfilled for 28.1 days in 2017.
- On average, recruiters spend a third of their week sourcing candidates.
Impact of COVID-19 on Hiring Statistics
- During the early days of the pandemic, employees were very reluctant to change jobs which meant a 47% drop in applications across all industries.
- In the US, COVID led to downsizing in the following industries: travel and tourism, hotels, bars and restaurants, entertainment, conferences, trade shows, and manufacturing.
Job Advertisement Statistics
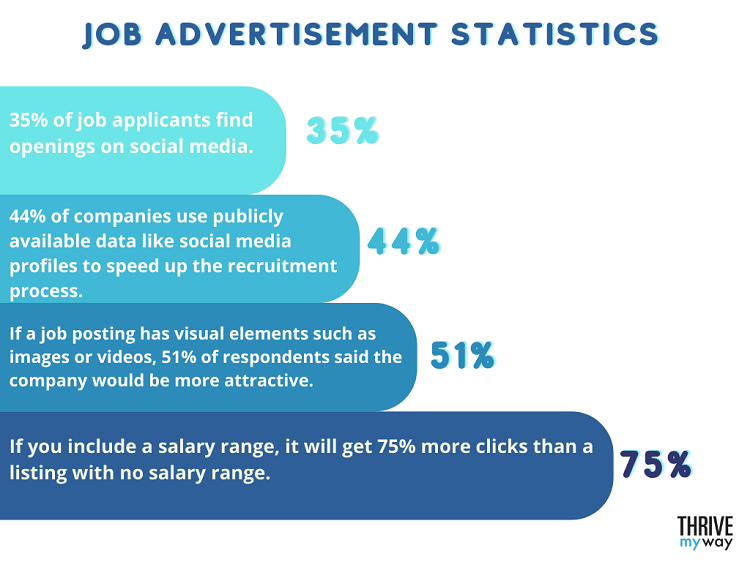
- 35% of job applicants find openings on social media.
- 44% of companies use publicly available data like social media profiles to speed up the recruitment process.
- If a job posting has visual elements such as images or videos, 51% of respondents said the company would be more attractive.
- If you include a salary range, it will get 75% more clicks than a listing with no salary range.
- According to SHRM (Society for Human Resource Management), the most wanted soft skills are dependability, teamwork, problem-solving, and flexibility.
- SHRM also points out that a job-posting language can deter diverse candidates.
Recruitment Software Statistics
Recruitment software will become increasingly sophisticated and comprehensive by offering greater integration with existing platforms, plus more analytics and automation capabilities. Companies that get ahead of the curve by embracing cutting-edge solutions are likely to be more successful in their sourcing of talent.
- The most popular applicant tracking software is as follows: BambooHR, SmartRecruiters, Workday, Submittable, and Greenhouse.
- Over 98% of Fortune 500 companies use recruitment software.
- 68% of recruiting professionals say that investing in new recruiting technology is the best way to improve recruiting performance.
- 94% of HR professionals say that using recruitment software has impacted their hiring process positively.
Digital Recruiting Stats
Artificial Intelligence for Recruiting Statistics
- 80% of executives think that AI can help improve performance and productivity in human resources.
- AI can help the recruitment process in many ways, for example: by answering questions from potential recruits, providing information and training as part of the onboarding process, tracking team member development, and acting as a personal assistant for handling schedules, filing, and assessments.
Chatbots for Recruiting Statistics
- When chatbots are used on career sites, 95% more job seekers become leads, 40% more job seekers complete an application, and 13% more job seekers click apply on a job requisition.
- The most common topics candidates ask chatbots are application and application status, benefits and compensation, and job search.
Social Recruiting Statistics
- If you don’t use social media recruiting as part of your interview process, it could lead to a significant loss of potential hiring volume as more than three-quarters of job seekers are likely to use it for their job search.
- The number of job seekers using social media rises significantly to more than 86% for young job seekers in the first ten years of their careers.
- Three-quarters of employees say their employers don’t promote their brand enough on social media platforms.
- Only 33% of employers in 15 global markets encourage employees to use social media, which means they’ve limited the chances of potential employees seeing positive things about the company.
Challenges for Recruiters Statistics
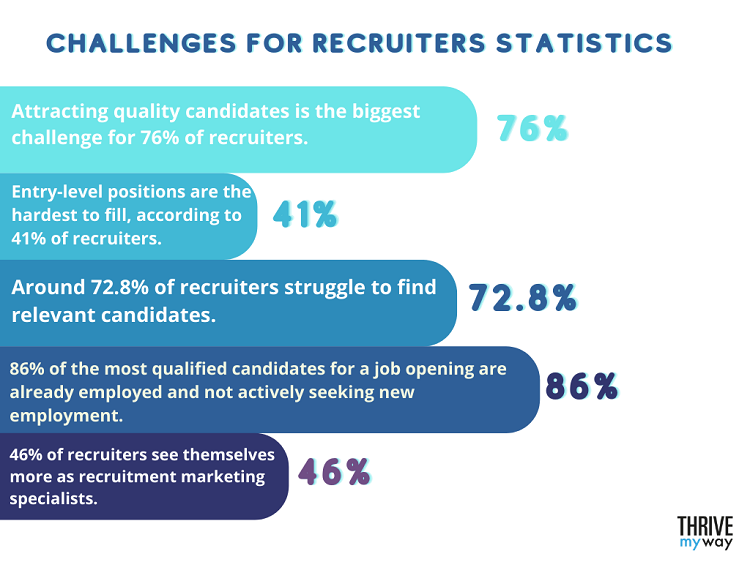
- Attracting quality candidates is the biggest challenge for 76% of recruiters.
- Entry-level positions are the hardest to fill, according to 41% of recruiters.
- Around 72.8% of recruiters struggle to find relevant candidates.
- Top candidates are typically only available for ten days before being hired.
- 86% of the most qualified candidates for a job opening are already employed and not actively seeking new employment.
- 46% of recruiters see themselves more as recruitment marketing specialists.
Workplace Culture Statistics
Women vs. Men Statistics
- 29% of men and 36% of women say flexible work arrangements are critical for them to consider a job.
- 41% of companies have seen an increase in the number of new hires that are women and minorities.
- The current global labor force participation rate for women is close to 49%, while it’s 75% for men.
- In countries in Northern Africa and the Arab States, unemployment rates for women exceed 16%.
- 70% of women, regardless of their employment status, prefer to work in paid jobs.
Leadership Statistics
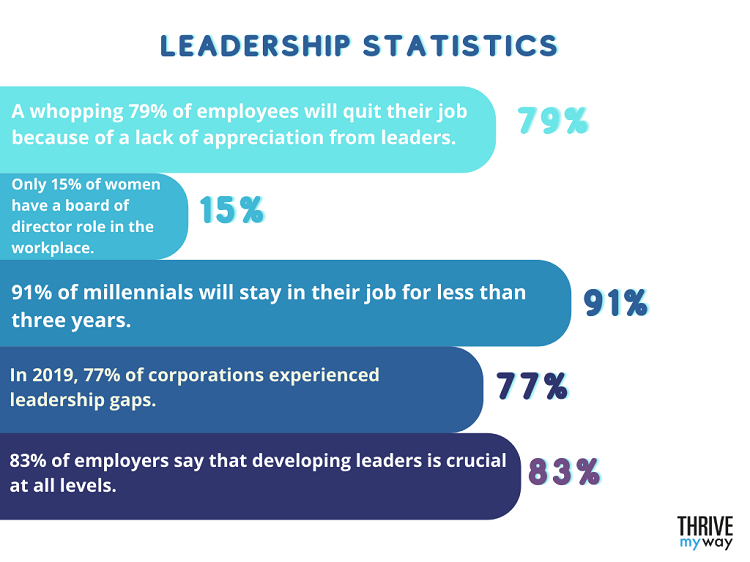
- Over 10,000 baby boomers retire every day.
- A whopping 79% of employees will quit their job because of a lack of appreciation from leaders.
- Only 15% of women have a board of director role in the workplace.
- 91% of millennials will stay in their job for less than three years.
- In 2019, 77% of corporations experienced leadership gaps.
- 83% of employers say that developing leaders is crucial at all levels.
Diversity Hiring Statistics
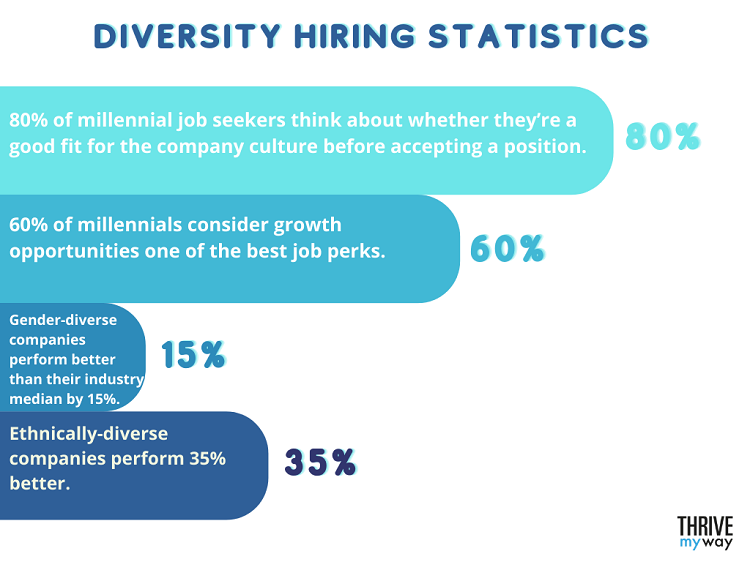
- By 2025, millennials are expected to make up most of the working population.
- 80% of millennial job seekers think about whether they’re a good fit for the company culture before accepting a position.
- 60% of millennials consider growth opportunities one of the best job perks.
- Gender-diverse companies perform better than their industry median by 15%.
- Ethnically-diverse companies perform 35% better.
Pre-Pandemic Global Workforce Statistics
- At the beginning of 2020, there were 7.9 million job openings.
- The global workforce consisted of 70% passive job seekers and 30% active job seekers.
- 86% of companies will invest in intelligence-sourcing software.
Pandemic Global Workforce Statistics

- In the European Union, unemployment is expected to rise to 8.6% by the end of 2021 due to the global pandemic.
- During COVID, there has been a 135% increase in remote job offerings.
- The pandemic has caused layoffs to rise to 12.8%.
- 60% of companies have currently put hiring on hold.
Talent Shortage and Candidate Sourcing Statistics
Team member Referral Statistics
- Talent shortages have risen to historic levels in the US, with 69% of employers experiencing problems filling jobs.
- Predictions are that by 2030 there will be a global human talent shortage of more than 85 million people.
Internal Hiring Statistics
- 36% of organizations rely on internal hiring.
- Internal hiring is 6x more effective than all other hiring sources.
- Internal hires retain organizational knowledge and get up to speed in their new roles more quickly than external hires.
- In 2013, 66% of positions were filled externally, while 26% were filled internally.
- The advantages of external hiring include injecting fresh ideas and new skill sets into a company.
Changing Jobs Statistics
Reasons for Changing Jobs Statistics
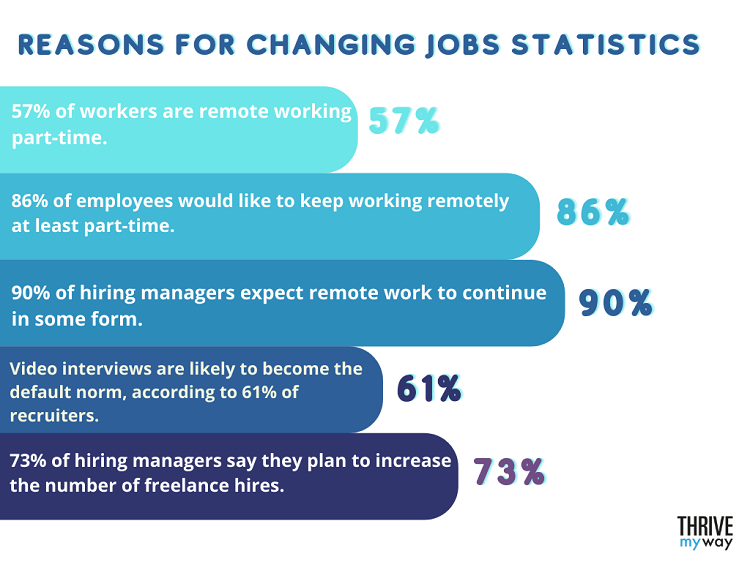
- 57% of workers are remote working part-time.
- 86% of employees would like to keep working remotely, at least part-time.
- 90% of hiring managers expect remote work to continue in some form.
- Video interviews are likely to become the default norm, according to 61% of recruiters.
- 73% of hiring managers say they plan to increase the number of freelance hires.
Demographics Statistics
- The average work age is 42 and rising because people work later in life.
- By 2030, the average work age is expected to increase by almost one year.
- 18 to 24-year-olds change jobs 5.7 times during a six-year period.
- People aged 23-34 hold, on average, 4.5 jobs.
Generations Statistics
- Millennials and Gen Zers are expected to dominate the job-changing trend in 2021.
- One in four workers plans to switch jobs this year.
- In 2020, one in five workers switched jobs, and 33% were identified as Gen Zers and 25% as millennials.
Bad Hire Costs Statistics
- Nearly three out of four employers are affected by poor hiring.
- Companies lose, on average, $14,900 on every bad hire.
- Team member morale can drop 32% as a result of a bad hire.
- Bad hires can result in a 36% drop in productivity.
Top Trends for the Future of Recruiting
For many job seekers, the recruiter is the first touchpoint with an organization, which makes the recruiter’s role a very valuable one.
Recruitment is currently going through many changes, so let’s look at how it’s changing to meet changing demand.
- Virtual recruiting: in a survey, 70% of companies said that at least half of their recruiting and onboarding is virtual.
- Remote work: one-third of companies say they are willing to hire remote workers from anywhere in the world.
- Automation: HRMS (Human Resources Management Systems) improve the candidate experience and helps with resume management, interview scheduling, and tracking candidate progress.
- Artificial Intelligence: AI technology can be used to find candidates, review resumes, and schedule interviews.
- Chatbots: Chatbots can help convert more applicants and increase the number of candidate leads.
- Predictive analytics: predictive analytics provides data to help recruiters make the right decisions.
- Benefits: expanding benefits is a very effective way to attract more candidates.
- Social recruiting: recruiters are broadening their scope and working on social media platforms such as Twitter, Facebook, Instagram, and more.
- Candidate matching software: 32% of recruiters use candidate matching software which leverages machine learning and AI to automate resume screening and shortlisting.
You might be interested to check those related posts as well:
- 38 Key Workday Inc Stats and Facts [Important Trends] 2024
- 35 Interesting Infosys Stats and Facts [and More] 2024
- 25 Impressive Business Travelers Stats 2024 [Facts & Trends]
FAQ
How many jobs will the average person have in their lifetime?
The average person has 12 jobs in their lifetime.
What is the average number of applicants per job?
On average, you can expect 118 people to apply for a single job.
What percentage of hires are bad?
As many as 50% of all new hires fail.
What percentage of applicants get an interview?
If you look at an average of 118 applicants, only 20% of them will get the chance for an interview.
Conclusion
2020 threw the world into turmoil, but the outlook for hiring worldwide has started to show signs of recovery.
Facts, figures, and HR statistics can help put recruitment into perspective.
If you know what the recruitment industry looks like, you’ve got the upper hand in the job market, and that’s why we’ve provided this list of HR statistics.
We used several sources when compiling the information, including the following:
- The Undercover Recruiter
- Fits Small Business
- Finances Online
- ShortLister
- TalentLyft
- CNBC
- GoRemotely
- Zety
- What to Become
- SHRM
- International Labour Organization
- Phenom
- Engage for Success