Nonprofits is an umbrella term that encompasses a range of different organizations such as charitable institutions, social welfare organizations, civic leagues, or social advocacy groups.
They all have one thing in common in that they are often a force for good in our modern world.
Nonprofits tackle a range of issues from animal welfare to culture and the arts and in this post, you’ll find out just a little more about how many there are and much more.
Nonprofit Statistics for 2024
- Worldwide, there are over 10 million non-governmental organizations and nonprofits.
- In the United States, there are around 1.3 million charitable or 501(c)(3) organizations.
- These nonprofit organizations account for around 10% of employment and between 5% and 10% of the economy in the US.
- One in every 10 working Americans works for an American nonprofit organization.
- The US state with the most nonprofits is California, followed by Texas and New York.
- Foundations, schools, and churches make up 40% of US nonprofits.
- The most common nonprofits in the US are religious organizations.
Nonprofit and Marketing Statistics 2024
- Volunteers are 200% more likely to make a donation than non-volunteers.
- Nonprofit marketing doesn’t just bring funding. It also drives volunteers.
- Almost one-third of online donations are made using a mobile device.
- Online videos help 79% of donors come to a decision about giving.
- Two-thirds of nonprofits are concerned about not taking advantage of the digital world.
- One-third of nonprofits in 2018 made an investment in social media ads.
- Worldwide, 18% of donations come via Facebook.
- Nonprofit emails have an open rate of between 15% and 17% for emails.
- People aged 55 and under are 40% more likely to volunteer.
- In the UK, two-thirds of volunteers are female.
- The average age of donors in the United States is 64.
- Non-cash assets are more likely to be donated by 27% of people.
- Nonprofit organizations can expect to achieve a 25% retention rate during the first year.

Nonprofit and Employment Statistics 2024
- 2018 saw around 63 million people in the US volunteering for nonprofits.
- In 2016, volunteer hours, in monetary terms, equaled almost $188 billion.
- People volunteer 52 hours of their time every year, on average.
- In 2013, 8.9% of salaries and wages were paid to the nonprofit sector, amounting to $634 billion.
- The nonprofit sector employs just under 12 million people in the United States.
Nonprofit Fundraising Statistics 2024
- Believe it or not, the majority of nonprofits do not rely on donations for support, almost half of their revenue comes by way of payment for services, goods, and programs.
- United States charities received approximately 175 million donations in 2019.
- School groups manage to raise over $1.5 billion annually by selling a variety of products.
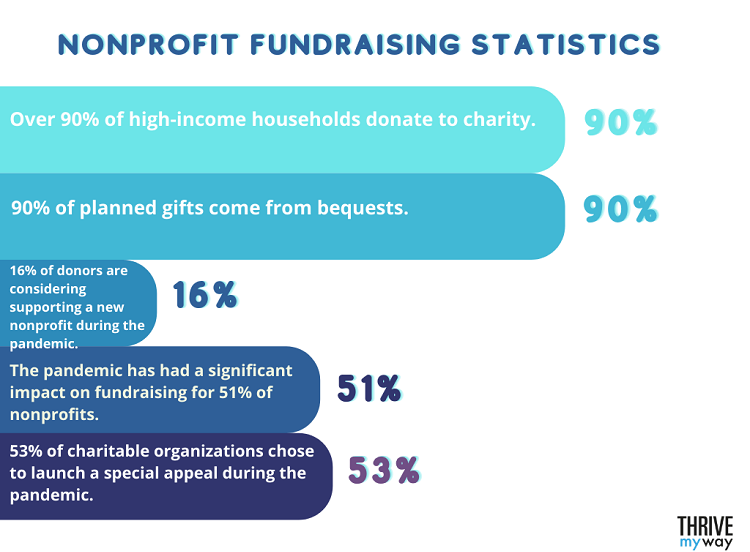
- Over 90% of high-income households donate to charity.
- 90% of planned gifts come from bequests.
- More than half of donors don’t expect the amount of their donations to change because of COVID.
- 16% of donors are considering supporting a new nonprofit during the pandemic.
- The pandemic has had a significant impact on fundraising for 51% of nonprofits.
- 53% of charitable organizations chose to launch a special appeal during the pandemic.
Nonprofit Growth Statistics 2024
- 2019 was one of the best-ever years for charitable giving at $449.64 billion.
- In 2019 the average gift was $616, while in 2020 the average gift had increased to $737.
- Since the start of the pandemic, there has been an increase in online giving by 21%.
- Between 2006 and 2016, there was an increase from 1.48 million to 1.54 million nonprofit organizations that had registered with the IRS.
- Over 10% of nonprofits expect their budgets to increase in 2022.
You might be interested to check those related posts as well:
- 99 Essential Free Tools for Nonprofits [in 2024]
- 25+ Great SBA Lending Statistics [You Must Know] 2024
- 30+ Valuable Crowdfunding Statistics [Facts & Trends] 2024
FAQs
How many nonprofit organizations are there in 2022?
The National Center of Nonprofits in the US reports there are more than 1.5 million registered charities in the US.
What are the most common nonprofits?
In the US, the most common types of nonprofits are charitable organizations, civil leagues and social welfare organizations, social advocacy groups, private charitable foundations, and corporate giving programs.
What is the average revenue of nonprofits?
The annual revenue of 76% of public charities is less than $99K. Annual revenue for 3% of public charities exceeds $5 million.
How many nonprofits fail?
According to data collected by the National Center on Charitable Statistics, around 30% of nonprofits fail before 10 years is up.
Conclusion
The statistics we’ve listed above only go to show the revenue potential these nonprofit organizations enjoy. People show their support for these nonprofits in a variety of ways, not just through monetary donations.
Volunteering their time and effort is another popular way to show support.
We used the following resources to compile this list of interesting nonprofit statistics, trends, and facts.
- Prosper Strategies
- Foundation Group
- Finances Online
- HubSpot
- Westerlund. co
- National Council of Nonprofits
- Planned Giving
- Statista
- Brighter Strategies
- G2