Digital analytics software is an essential tool for any business that wants to gain insight into customer behavior and optimize its online presence. It helps them understand how visitors interact with their websites, applications, and other digital channels.
Digital analytics software can track website traffic, analyze visitor behavior, measure conversions, and provide valuable insights that businesses can use to improve their digital marketing strategies and enhance the user experience.
With the help of digital analytics software, businesses can identify trends in customer behavior and make data-driven decisions to increase website engagement and conversions.
#1: Google Analytics
Google Analytics is a piece of software used for digital analytics, that enables companies to monitor conversions, design unique reports, and establish objectives. The platform also provides integration with other programs and systems, like Google Tag Manager and Google AdWords
Top Google Analytics features
Ability to track and measure website traffic and user behavior
The ability to watch and measure website traffic and user activity is Google Analytics’ top feature.
The application offers a variety of information and indicators, including pageviews, sessions, user demographics, and conversion rates, that can assist organizations in determining how well their website is functioning and how it is being utilized.
A more complete picture of a company’s online marketing efforts can be obtained by integrating Google Analytics with other tools and platforms like Google Tag Manager and Google AdWords.
Ability to collect and provide information in real-time
This feature allows you to see detailed information about how people are using your website in real time. You can see things like how many people are visiting your site, where they’re coming from, what pages they’re looking at, and how long they’re staying on your site.
This can be helpful in understanding what’s working well on your site and what needs improvement.
It’s important to understand how people are using your website so that you can make changes accordingly. If you see that people are leaving your site quickly or not converting into customers, you may need to make some changes in order to improve the user experience or offer more relevant content.
Additionally, if you see that certain pages are getting a lot of traffic but not much conversion activity, you may want to consider adding more call-to-action buttons or links on those pages.
Ability to track conversions
Conversion tracking is the second most crucial function of Google Analytics. This helps companies optimize their websites for higher conversion rates by enabling them to know which of their marketing strategies are generating leads and sales.
The platform also provides a wide range of services that can aid organizations in enhancing their general performance, such as bespoke reports and goals.
The ability to track conversions is essential for any business that wants to succeed in digital marketing. By understanding which campaigns are resulting in sales and leads, businesses can optimize their website and marketing efforts for better results.
Additionally, the platform’s other features can help businesses improve their overall performance and ROI.
Pros and cons of Google Analytics
Pros
- Comprehensive data and metrics
- Real-time information
- Ability to track conversions
- Customizable reports and goals
- Integration with other tools and platforms
Cons
- Limited historical data
- The interface can be overwhelming
- Difficult to interpret data
Pricing
Pricing for Google Analytics starts at $150 per month. There is also a free trial available.
$150/month seems expensive compared to other digital analytics software on the market. However, it does offer a free trial so that users can try it before they commit to purchasing it.
Conclusion
The price of Google Analytics is higher. It does, however, provide a free trial so that people can use it before deciding to buy it. The platform also provides a vast array of features and connectors that can aid firms in enhancing their general performance
#2: Amplitude Analytics
A software program called Amplitude Analytics aids businesses in monitoring customer behavior and gauging the effectiveness of their products. The platform offers companies useful user behavior data, such as segmentation, funnel analysis, cohort analysis, and user journeys.
Additionally, Amplitude’s versatile query builder enables customers to create bespoke queries fast in order to address their own inquiries.
Top Amplitude Analytics features
Digital Analytics Software
The digital analytics software from Amplitude is a tool that aids businesses in tracking user behavior and gauging the effectiveness of their products. The platform offers companies useful user behavior data, such as segmentation, funnel analysis, cohort analysis, and user journeys.
Additionally, Amplitude’s versatile query builder enables customers to create bespoke queries fast in order to address their own inquiries.
This feature is important for companies that want to track user behavior and measure product performance. By understanding how users interact with their products, companies can optimize their customer experiences and retention strategies.
Additionally, the ability to build custom queries allows businesses to answer specific questions about their data.
Funnel Analysis
Amplitude’s #2 feature is their “Funnel Analysis” tool. With Funnel Analysis, businesses can see which users are dropping off at what point in their customer journey. This information can be used to improve the user experience and increase conversions.
Understanding where users are dropping off in your funnel is critical for optimizing your conversion rate. By understanding which steps in the funnel are causing users to drop off, you can make changes to improve the user experience and increase conversions.
Cohort Analysis
With cohort analysis, you may compare and contrast how different user groups engage with your product by putting them in groups based on shared traits or behaviors.
This feature allows you to see how different groups of users interact with your product over time so that you can identify which features are resonating (or not) with different segments of your audience.
Additionally, cohort analysis can help you pinpoint where users are dropping off in the customer journey so that you can make changes to improve the experience for future users.
Pros and cons of Amplitude Analytics
Pros
- An easy-to-use platform that provides valuable insights into user behavior
- Flexible query builder allows businesses to answer specific questions about their data
- Funnel analysis tool helps businesses understand where users are dropping off in the customer journey
- Cohort analysis allows businesses to see how different groups of users interact with your product over time
- Normalized metrics allow for easy comparison of cohorts
Cons
- Data can take some time to populate
- Limited customizability in dashboards
- Extended features are paywalled
Pricing
Amplitude Analytics is expensive in the market for a tool that does Digital Analytics Software. They have a free trial, and you have to get a quote for pricing.
Conclusion
Compared to alternatives like Heap and Mixpanel, Amplitude Analytics is more expensive. However, their platform provides businesses with valuable insights about user behavior, including segmentation, funnel analysis, cohort analysis, and user journeys.
Additionally, Amplitude’s flexible query builder allows users to quickly build custom queries to answer their own questions.
#3: Semrush
We employed Semrush as a piece of software for our digital analytics program. It stands out from other tools due to its position-tracking feature, which continuously tracks a website’s advancement in the SERPs and generates in-depth data.
Also, customers have the option of setting up unique alerts for when their keywords change positions.
Top Semrush features
The Position Tracking Tool
The position tracking tool monitors a website’s progress in the SERPs on a daily basis and produces detailed reports. It also allows users to set up custom alerts for when their keywords move up or down in ranking.
The position tracking tool is valuable because it allows companies to measure their progress over time and identify areas where they need to improve their SEO efforts. Additionally, being able to set up custom alerts helps ensure that companies are always aware of changes in their keyword rankings.
We used the position tracking tool to monitor our website’s ranking for various keywords over the course of several months. We found it to be very accurate and helpful in identifying both positive and negative trends in our keyword rankings.
Additionally, we were able to use the custom alert feature to set up alerts for when our keywords moved up or down in ranking. This helped us stay on top of our SEO efforts and make adjustments as needed.
SEO Ideas
The SEO Ideas feature provides users with a list of potential keywords to target for their website, based on factors such as search volume, competition level, and keyword difficulty.
The SEO Ideas feature is useful for companies that want to improve their website’s ranking in search engines. By providing a list of potential keywords to target, the feature can help companies identify opportunities for improving their website’s visibility and traffic levels.
Projects
The projects feature allows you to track the progress of your website’s SEO over time by creating individual projects for each site. You can then add tasks, set deadlines, and assign team members to each project.
This is a great way to stay organized and ensure that all aspects of your SEO plan are being executed properly.
This is an important feature for companies that want to do digital marketing because it helps them keep track of their progress and ensure that they are on track to meet their goals. Additionally, this tool can help identify areas where improvement is needed so that corrective action can be taken.
Pros and cons of Semrush
Pros
- Insights on competitor’s performance and off-page SEO strategy.
- Useful market data for future efforts (PPC, SEO).
- Ability to detect critical issues on the website.
- A visually appealing interface that highlights the next steps easily.
- A rare tool that gives you the capability to form a full strategy without the need to switch to another tool.
Cons
- Pricey even compared to similar products.
- Unsolicited calls and emails from “Product Specialists” trying to upsell you.
- Some difficulty understanding how to use some features at first.
Pricing
$399.95 for a one-time payment for Semrush. In the market for Digital Analytics Software, this price is considered expensive.
Semrush does have a free trial that you can use to test out the tool before committing to a purchase. Pricing for Semrush is quote-based, so you’ll need to get in touch with their team to get pricing information.
Conclusion
Semrush costs more money. It does, however, provide a more complete collection of capabilities, which may make the additional cost worthwhile for some businesses. In addition, Semrush offers a free trial so consumers can try it out before making a purchase.
Semrush, while being more expensive than its rivals, comes in at number three on our list due to the extensive feature set it provides.
The position tracking tool is very beneficial for tracking development over time and highlighting areas that require work. The personalized alert tool also makes sure that businesses are constantly informed of changes in their keyword rankings.
#4: Pendo
Pendo is a piece of software that aids businesses in monitoring and analyzing consumer behavior. This includes tools like conversion funnels, session recordings, and heatmaps.
Pendo’s In-app Guides also give businesses the ability to design and distribute guided tours within their web application to aid in guiding customers through the capabilities of the app.
Top Pendo features
Digital Natives
Pendo’s “digital natives” feature is a set of tools that help companies track and analyze the behavior of their customers. This includes features such as heatmaps, session recordings, and conversion funnels.
The digital natives feature is important because it helps companies understand how their customers interact with their products or service.
This understanding can then be used to improve the customer experience and increase conversions. Additionally, this feature can also help identify areas where customers are struggling so that those areas can be addressed.
In-app Guides
Pendo’s #2 feature is their “In-app Guides.” This feature allows a company to create and deploy guided tours within their web application to help guide users through the features of the app.
The In-App guides are created using a WYSIWYG editor and can be deployed without having to write any code. Once created, the guides can be targeted to specific segments of users, based on criteria such as user location or platform type.
The In-app Guides offer users an engaging method to learn about new capabilities in the app, which is helpful for businesses looking o enhance product uptake and engagement. The instructions can also be utilized to support clients or respond to their usual inquiries.
Overall, this feature has been a good experience for us. We have discovered that it can be challenging to tailor the guide’s content to particular user groups. If there are modifications to the app, it may also be challenging to timely update and distribute the guidelines.
Event Tracking
The process of recording particular events that take place within your digital product, such as button clicks, page views, or form submissions, is known as event tracking.
You may gain a better understanding of how people engage with your product and any potential trouble spots by keeping track of these events. Event data can also be utilized to state in-app notifications or other user experience improvements.
In order to track events, Pendo uses a combination of Javascript code and HTML tags placed on each page of your site or application.
When an event occurs, Pendo’s Javascript code sends information about the event (such as the type of event and when it occurred) to our servers. This information is then processed and stored in our database so that it can be analyzed later.
Event data helps you understand how users interact with your product and where they may be struggling. Additionally, this data can be used to trigger in-app messages or other interventions aimed at improving the user experience.
Pros and cons of Pendo
Pros
- Pendo’s digital native feature is a set of tools that help companies track and analyze the behavior of their customers.
- The In-app Guides are useful for companies that want to increase product adoption and engagement by providing an interactive way for users to learn about new features in the app.
- Event data helps you understand how users interact with your product and where they may be struggling. Additionally, this data can be used to trigger in-app messages or other interventions aimed at improving the user experience.
- Pendo’s support team is able to help customers overcome obstacles and successfully implement event tracking within their product.
- The company offers a free trial so that potential customers can test out the features of the software before committing to a purchase.
Cons
- The cost of the software may be prohibitive for some companies, especially small businesses or startups.
- The software can be difficult to use if you don’t have a background in coding or analytics.
- Some features, such as the In-app Guides, can be difficult to update and deploy in a timely manner if there are changes to the app.
Pricing
There are three pricing plans for Pendo: Starter, Professional, and Enterprise. The starter plan is free and includes up to 5 users. The professional plan is $399/month and includes up to 50 users. The enterprise plan starts at $999/month.
Compared to other digital analytics tools available on the market, Pendo’s price appears high. It does, however, provide a free trial, which is advantageous for individuals who wish to experience the product before deciding to buy.
It’s also crucial to remember that Pendo’s enterprise plan pricing varies depending on the needs of the customer, so you must request a quote in order to see how much it will cost you.
Conclusion
Compared to alternatives like Heap, Mixpanel, and Google Analytics, Pendo is on the expensive side. However, it does offer a free trial which is helpful for those who want to try the product before committing to a purchase.
Additionally, Pendo’s digital natives’ feature is unique and can be very helpful in understanding customer behavior.
#5: Looker
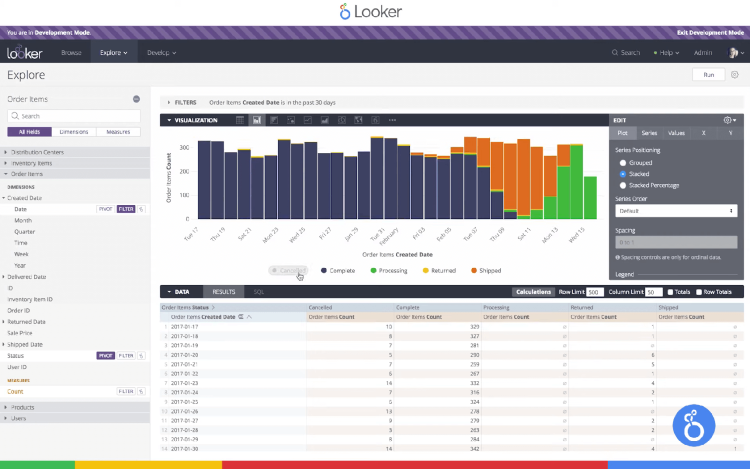
We utilized Looker as a software solution for our digital analytics software. It stands out because it enables users to access a wide range of data sources, such as relational databases, data warehouses, and other cloud data warehouses.
Once linked, users can utilize the Looker interface to explore the data and design their own dashboards and reports.
Top Looker features
Data exploration and Visualization
The main advantage of Looker is its data exploration and visualization capabilities. Users of the platform can connect to numerous data sources, such as relational databases, data warehouses, and other cloud data warehouses.
Once linked, users can utilize the Looker interface to explore the data and design their own dashboards and reports. Other security capabilities provided by Looker include user authentication, access control, and security auditing.
Businesses that wish to use their data to make better decisions need to consider the importance of data exploration and visualization.
Looker’s ability to link to various data sources enables firms to consolidate their data and do analysis in a single location. Additionally, Looker’s security capabilities aid in shielding companies from illegal access to important data.
Unify Data
Users of Looker’s Digital Analytics Software software product can combine data from several data sources in one location thanks to a feature in the tool. This is accomplished by establishing a connection between Looker and the data source and then developing a “data model” that specifies how the data should be set up.
Once the data model has been developed, Looker can construct SQL queries that will automatically extract the required data from the source.
This feature is useful for companies that want to do digital analytics because it allows them to unify their data in one place. This makes it easier to perform analysis and make decisions because all of the relevant information is in one place.
Additionally, this feature can save time because SQL queries are generated automatically.
LookML
For the purpose of exploring data, Looker’s modeling language is used to specify dimensions, metrics, and filters.
Companies may simply adapt their data exploration and analysis to their own needs thanks to the simplicity of creating bespoke models. Also, by having all users speak the same modeling language, it is possible to guarantee that everyone is using the same definitions for terms and metrics.
Pros and cons of Looker
Pros
- Looker is easy to use and has a great interface
- Looker is very flexible and can be customized to fit your specific needs
- Looker offers a wide range of security features to protect your data
- Looker allows you to connect to multiple data sources in one place
- LookML is a powerful tool for defining data models
Cons
- Looker can be difficult to use if you don’t have a technical background
- The price of Looker can be prohibitive for some companies
- There is a learning curve associated with using LookML
Pricing
Looker has a few pricing options, depending on the features you need. The cheapest option is $3,000/month, and the most expensive option is $6,000/month.
Commentary: Looker’s prices are expensive compared to other digital analytics software tools on the market. However, they do offer a free trial so that users can try out the tool before committing to it.
You also have to get a quote for pricing, which may not be ideal for those who want to know how much they will be paying upfront.
Conclusion
Looker’s cost is high when compared to substitutes like Google Analytics and Adobe Analytics. To allow people to test out the product before purchasing it, they do provide a free trial. You must also request a price quote, which might not be appropriate for people who prefer to know their upfront costs.
Due to its strong data modeling capabilities and robust access control features, Looker is ranked #5 on our list. The platform is additionally adaptable and adjustable, enabling firms to meet their unique needs. Unfortunately, Looker may not be affordable for some companies due to the high cost.
#6: Mixpanel
A digital analytics tool called Mixpanel assists businesses in monitoring user activity on websites and mobile applications. It offers information that may be utilized to analyze user behavior and pinpoint areas for development.
Mixpanel is an effective tool for learning about user behavior because it also provides a variety of tools for segmentation, engagement, and retention analysis
Top Mixpanel features
Digital Analytics Software
Mixpanel is a piece of digital analytics software that aids businesses in monitoring customer behavior on websites and mobile apps. It offers information that can be utilized to comprehend how customers use a product and spot areas for development.
A strong tool for collecting insights into user activity, Mixpanel also provides a variety of tools for segmentation, engagement, and retention analysis.
The ability to track and analyze user behavior is essential for any company that wants to improve its product or marketing efforts.
WithMixpanel’s extensive data tracking capabilities, companies can gain valuable insights into how their users interact with their products and make informed decisions about where to focus their resources.
Insights
With the help of the insights function, you can look at the most significant app events and delve further into each one to learn more about who participated, what they were wearing, when they did it, and other details.
This feature is made to make it easier for you to comprehend what’s occurring in your app so that you may take steps to make it better.
This feature matters because it helps you understand what users are doing in your app so that you can take action to improve the user experience.
Additionally, this data can be used to inform marketing and sales decisions. For example, if you see that a certain number of users are completing a purchase flow but not finishing checkout, you could target those users with ads or emails encouraging them to complete their purchase.
Segmentation
A population is segmented when it is broken up into smaller groups based on shared traits. Users of Mixpanel can divide their data in a number of ways, such as by geography, device type, and user activity.
Segmentation is important because it allows companies to target specific groups of users with tailored messages and content. Additionally, segmentation can be used to identify trends and patterns in user behavior.
We used segmentation to understand how our app was being used by different types of users. This allowed us to identify areas for improvement and make changes that would improve the overall experience for all users.
Pros and cons of Mixpanel
Pros
- Extensive data tracking capabilities
- Variety of tools for segmentation, engagement, and retention analysis
- The insights feature helps you understand what users are doing in your app
- Segmentation allows you to target specific groups of users with tailored messages
- Data can be used to inform marketing and sales decisions
Cons
- Overlapping filters can be confusing
- Lack of historical data for user properties
- some events triggered by iOS users don’t have their properties in place
Pricing
Mixpanel’s pricing is very affordable in the market for a tool that does digital analytics software. They have a free trial, and you do not have to get a quote for their pricing.
Conclusion
Mixpanel is a lot less expensive than substitutes like Google Analytics. Moreover, Mixpanel does not demand that users obtain a price quote and offers a free trial.
Because it is a cheap digital analytics tool that offers information that can be utilized to enhance products or marketing initiatives, Mixpanel comes in at number six on our list. The platform also provides a range of segmentation, engagement, and retention analysis capabilities.
Final Words
Digital analytics software is an essential tool for businesses that are looking to measure and track the performance of their digital marketing campaigns. It can help you analyze customer behavior, make data-driven decisions, and optimize your campaigns in order to maximize ROI.
With the digital analytics software, you can gain valuable insights into customer behaviors and preferences, enabling you to create more effective strategies for targeting them.
Additionally, digital analytics software can help you identify areas that need improvement in your campaigns and provide actionable recommendations for improving results.
With this information at hand, businesses can make informed decisions about their marketing strategies and optimize their campaigns for better performance.