
Google’s transition from Universal Analytics (UA) to Google Analytics 4 (GA4) has introduced a fundamental shift in how web data is collected and reported.
For businesses and marketers relying on digital metrics, the change affects how success is tracked and how decisions are made.
Knowing how metrics differ between UA and GA4 is critical to avoid reporting errors and misinterpretation.
The Shift in Data Models
UA used a session and pageview-based structure to organize data. Interactions were grouped into sessions, typically anchored around movement between pages.
Metrics focused heavily on duration of visits and number of pageviews.
GA4, by contrast, uses an event and parameter-based model where every interaction is treated as an event.
With GA4, structure moves away from relying on pageview sequences and shifts toward tracking user actions. Interpretation requires attention to the flow of events rather than page progression. This method leads to more detailed behavioral insights but also demands a revised analytical approach.
Key distinctions between the two models include:
- UA model:
- Relies on sessions and pageviews.
- Groups actions by time and page transitions.
- Measures engagement through duration and volume of pages viewed.
- GA4 model:
- Tracks every interaction as an event.
- Uses customizable parameters (e.g., page_title, link_text) for greater detail.
- Focuses on behavior and action over time or structure.
Such differences impact how funnels, drop-offs, and key metrics are interpreted.
Adapting analysis methods ensures data reflects actual user behavior rather than outdated measurement standards.
Users
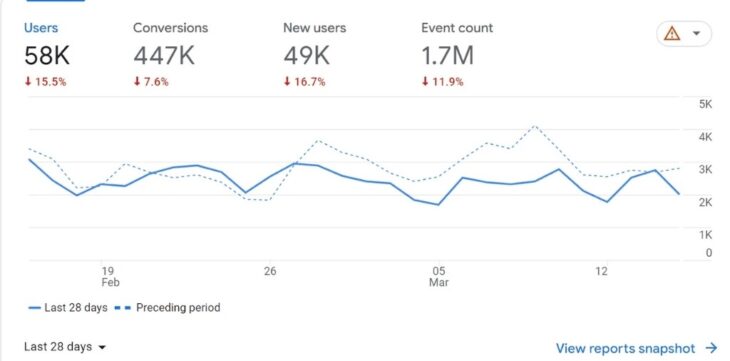
User measurement in UA relied on device-based tracking, primarily using Client ID cookies. Each time someone visited a website through a new browser, or cleared their cookies, a new user was counted.
That method often led to inflated totals, especially in multi-device or privacy-conscious scenarios. Returning visitors were recognized only if the same cookie remained intact.
GA4 adopts an event-based approach tied to User ID, offering stronger consistency across sessions and devices. Instead of relying on browser-specific identifiers, it focuses on meaningful interaction. Active Users now lead as the primary metric, capturing those who engage during a session with measurable activity.
Main differences between the platforms include:
- UA:
- Users tracked by Client ID (browser cookie)
- Return recognition limited by cookie retention
- Higher risk of double-counting across devices
- GA4:
- Users tracked by events tied to User ID
- More accurate across devices and platforms
- Active Users reflect engaged sessions, not just visits
Lower user numbers reported in GA4 do not indicate loss of traffic. They reflect improved clarity in user identification and eliminate duplicate or fragmented counts.
Sessions
UA managed sessions as time-bound periods that ended at midnight or whenever the traffic source changed.
A visitor clicking a campaign link, leaving, and returning an hour later via another campaign would be counted as two sessions. These definitions led to inflated totals.
GA4 uses session IDs that persist across traffic sources and midnight resets. Sessions only end due to inactivity or timeouts. GA4 also uses estimation models to adjust for data gaps created by privacy settings or blocked scripts.
Here are the key differences:
- UA sessions reset at midnight and on source changes
- GA4 sessions persist until user inactivity ends them
- GA4 applies modeling to account for incomplete data
GA4 often reports 10% to 30% fewer sessions. Lower numbers indicate closer alignment with real interaction patterns, not reduced engagement.
Bounce Rate vs Engagement Rate
UA considered a bounce to be any single-page session without further interaction. A visitor could read an entire article, leave satisfied, and still be counted as a bounce. This overlooked valuable behavior.
GA4 introduces a redefined approach. A session is labeled non-engaged if it:
- Lasts fewer than 10 seconds
- Contains no conversions
- Registers no interactive events
Engagement Rate serves as the counterpoint to bounce rate, highlighting the proportion of sessions with meaningful interaction. Focus shifts to the quality of engagement rather than surface-level depth.
This new metric improves behavioral insight. Passive users are no longer penalized for behavior that still offers value to the business.
Conversions
UA supported several goal types, including:
- Destination page visits
- Session duration thresholds
- Page counts
- Specific event completions
Each goal could only register once per session, no matter how many times the user completed it.
GA4 defines conversions as event-based actions called Key Events. Users can decide if a Key Event should count:
- Only once per session
- Every time it occurs
This structure offers more control. Setup must be tailored to ensure proper capture of valuable actions.
For businesses in competitive sectors, such as financial technology, partnering with a fintech SEO agency can help identify and prioritize key interactions that align with campaign objectives and lead generation goals.
With GA4’s flexibility, conversion metrics can finally reflect real user behavior with greater precision.
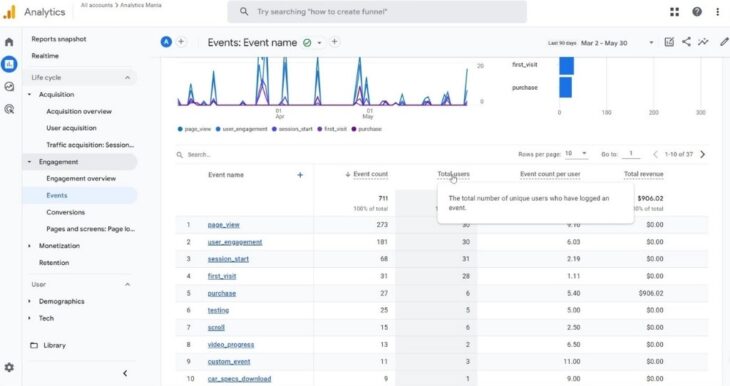
Events
UA followed a rigid structure requiring each event to be labeled with a:
- Category
- Action
- Label
This model demanded predefined planning and lacked adaptability for advanced behavior tracking.
GA4 treats all user actions as events, each with parameters for added context. Developers can reuse event names and differentiate interactions using variables like device_type or link_location.
Key structural changes include:
- Elimination of rigid category-action-label formatting
- Event names become flexible and reusable
- Custom parameters add context and detail
GA4 typically logs more events than UA. That increase results from expanded interaction capture, not data inflation.
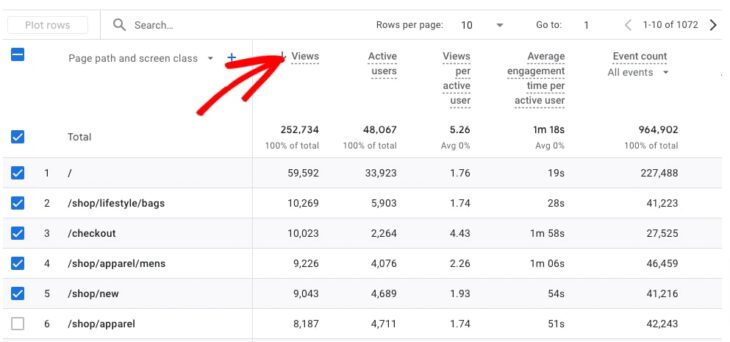
Pageviews vs Views
UA tracked both Pageviews and Unique Pageviews.
Pageviews counted every occurrence, including repeated visits to the same page.
Unique Pageviews filtered out repetitions within the same session, offering a cleaner perspective.
GA4 combines both page and screen views into a single metric labeled Views. This aggregation enables unified tracking across websites and apps.
Key distinctions include:
- UA separates pageviews and unique counts
- GA4 merges all views under one metric
- GA4’s Views may vary due to app inclusion and filter settings
Careful comparison requires attention to platform-specific settings and filters used. View counts may differ, not because of traffic shifts, but because of structural consolidation.
Final Thoughts
GA4 introduces more than a fresh interface. It represents a shift in measurement philosophy. Businesses relying on UA habits will need to adapt both mindset and strategy.
Accurate comparisons demand awareness of how each platform defines its metrics. Looking only at numbers side-by-side leads to confusion. Instead, alignment requires revisiting KPIs and adjusting how success is measured.
A dual setup of UA and GA4 during the transition period is essential. Redefining what constitutes performance will ensure reporting remains meaningful in a data environment shaped by privacy and cross-platform tracking evolution.