Your GPU (Graphics Processing Unit) is the beating heart of your PC when it comes to visual computing. Whether you’re rendering complex 3D designs, mining cryptocurrencies, or just playing the latest video games, the graphics card is a crucial hardware component that needs to function optimally for your system to perform well.
However, just like any other piece of hardware, your GPU is subject to wear and tear, driver updates, and other external factors that can impact its performance and health. In this guide, we’ll talk about the various methods you can use to check your graphics card’s health, from simple monitoring tools to more advanced diagnostic techniques.
Why GPU Health Matters
Your Graphics Processing Unit (GPU) is not just for gaming; it’s a multi-purpose workhorse that handles everything from video rendering to AI computation. As such, keeping an eye on your graphics card’s health can save you from unexpected downtimes and costly repairs.
In this section, we will explore why monitoring your GPU is crucial for your overall system’s efficiency and longevity.
The Role of the Graphics Card
The graphics card is responsible for processing all graphical data in your system, but its capabilities don’t end there. Many modern applications and even some programming languages are designed to offload certain computational tasks from the CPU to the GPU. Given its importance, a failing GPU can lead to system crashes, loss of data, and reduced productivity.
What Can Go Wrong?
- Overheating: Due to intensive tasks like gaming or 3D rendering, graphics cards can get extremely hot, causing thermal throttling or permanent damage.
- Driver Conflicts: Outdated or incompatible drivers can result in system instability.
- Physical Damage: Physical factors like dust buildup, improper installation, or mechanical damage can impact performance.
Know Your Graphics Card: Basic Information
Before you can diagnose any issues or track performance, you first need to understand what kind of graphics card you have. It’s like knowing the make and model of your car before you can perform any meaningful maintenance. In this section, we’ll talk about how to find basic information about your GPU.
Finding Your Specifications
On a Windows system, you can easily check your GPU specifications via the Device Manager. Just type “Device Manager” in the Start menu, navigate to “Display adapters,” and you’ll see your graphics card listed there. On a Mac, go to “About This Mac” and click on the “Displays” tab. For Linux users, the command lspci | grep VGA in the terminal will provide information about the GPU.
Understanding Specifications
Understanding your graphics card specifications is key for many reasons. Knowing the make, model, and other key features will help you:
- Choose the right software and drivers.
- Conduct more accurate benchmark tests.
- Decide whether your GPU needs an upgrade.
Software Solutions for Monitoring
In the digital age, you don’t have to be a hardware guru to keep an eye on your GPU’s health. There are numerous software solutions available that allow you to monitor everything from temperature to memory usage. Let’s explore both built-in utilities and third-party applications that can help you in this endeavor.
Built-in Utilities
Every modern operating system comes with some utilities that can help you monitor your GPU. Although these may not be as comprehensive as some third-party options, they are reliable and easy to use.
Windows Task Manager
In Windows, you can open the Task Manager by pressing Ctrl + Shift + Esc. Here, under the “Performance” tab, you can see real-time GPU utilization and memory usage. It’s simple but effective for a quick check.
macOS Activity Monitor
On a Mac, you can open the Activity Monitor through the Utilities folder in Applications. Although not as detailed as the Task Manager in Windows, it still provides useful data like GPU memory usage.
Third-Party Applications
If you need more detailed insights into your GPU’s health, third-party software applications offer advanced features like temperature tracking, fan speed control, and much more.
MSI Afterburner
MSI Afterburner is one of the most popular GPU monitoring tools. It provides a wide array of statistics and allows you to tweak settings like fan speed and core voltage, making it a robust tool for advanced users.
HWMonitor
Another useful application is HWMonitor, which gives you a snapshot of various system metrics, including GPU temperature and voltage. It’s simpler than MSI Afterburner but still offers sufficient detail for most users.
Physical Inspections: What to Look For
Software tools provide valuable data, but nothing can replace a good old-fashioned physical inspection. Here, we’ll guide you on what to look out for when inspecting your GPU for potential problems.
Dust and Debris
Dust is the enemy of any computer system. While it may seem harmless, dust buildup can block airflow, causing your graphics card to overheat.
Checking for Dust
To check for dust, turn off your computer and open the case. Examine the GPU and its surrounding areas. If you notice a layer of dust, you can clean it using compressed air. Remember to blow air from a distance to avoid damaging the components.
Physical Damages
Apart from dust and debris, physical damages like bent pins or burnt spots can also harm your GPU.
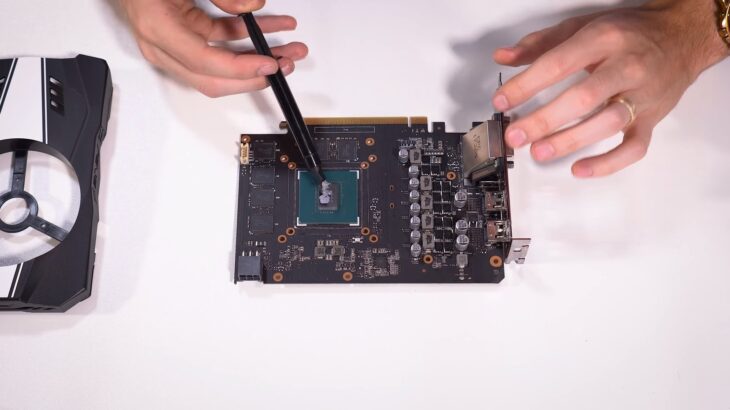
Identifying Physical Damages
Inspect the graphics card for any visible damages, such as bent pins or burnt spots. Such damages are often irreversible and indicate that you may need to replace the GPU.
Running Benchmark Tests
Benchmark tests are like the stress tests of the computer world. They push your graphics card to its limits, allowing you to identify any issues that might not be visible during normal use. In this section, we’ll look at how to run these tests and interpret the results.
Why Benchmark?
Benchmark tests can tell you a lot about your GPU’s health. If your graphics card is unable to complete the benchmark or if it performs significantly worse than expected, it could be an indication that something is wrong.
How to Run a Benchmark
Many tools can run a GPU benchmark. One of the most popular is 3DMark, which offers various tests to suit different types of graphics cards. To run a benchmark:
- Download and install the software.
- Select the test you wish to run.
- Compare the results with online data for similar GPUs.
Common Problems
Knowing how to identify common graphics card problems can save you a lot of time and stress. In this section, we will outline some of the typical issues GPUs face and their possible solutions.
Artifacts and Glitches
Artifacts are graphical anomalies that appear on the screen. They may indicate issues like overheating or driver conflicts. To solve this, try:
- Updating your drivers.
- Reducing the graphical load on the GPU.
Frequent Crashes and Errors
If you experience frequent crashes or error messages related to the GPU, it may be due to software conflicts or insufficient power supply. Possible solutions include:
- Updating drivers.
- Checking for software conflicts.
- Upgrading your power supply unit (PSU).
Consulting Professional Help
Sometimes, despite your best efforts, you may need to consult professionals for a thorough diagnosis and repair. In this section, we’ll talk about when to seek professional help and what to expect.
When to Consult a Professional
If you’ve tried all of the above methods and still experience problems, it’s time to consult a professional. Persistent issues like overheating, glitches, and performance drops are signs that professional intervention is needed.
What to Expect
A professional will conduct a thorough diagnostic test, checking for both hardware and software issues. They might even need to replace certain parts, so be prepared for some expense if your GPU is out of warranty.
FAQs
What preliminary steps should I take before checking my graphics card?
Before proceeding with any tests, make sure you have the latest drivers installed for your graphics card. Disable any overclocking settings, and ensure that your CPU, RAM, and motherboard are in good working condition.
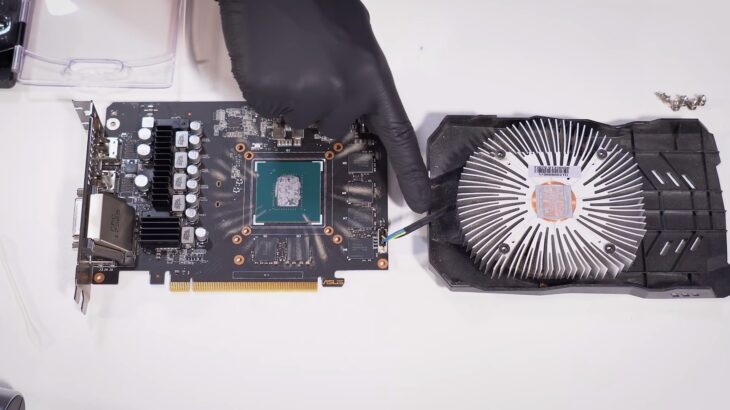
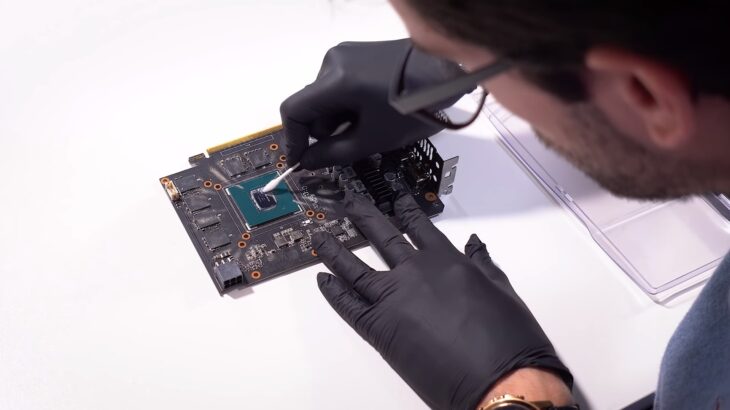
How do I check the hardware components of my graphics card?
Turn off your PC and disconnect it from power. Inspect the cooling fan(s) to make sure they are in good working order. Check the thermal paste and replace it if necessary. Make sure the heatsink is clean and free of dust.
How can insufficient cooling affect my graphics card’s performance?
Insufficient cooling can lead to overheating, which may result in frame rate drops, lag, or choppiness during gaming or other graphically intensive tasks.
What should I look for when seating the graphics card in the expansion slot?
Ensure that the card is securely seated in the correct PCI-E expansion slot as specified in your motherboard’s manual. Make sure all extra power supply cables are plugged in properly.
How do I disable overclocking before testing?
You can disable overclocking through the software you used for overclocking or through your computer’s BIOS settings.
How do I monitor the temperature of my graphics card during stress tests?
You can use additional panels in Furmark, such as GPU-Z and GPU Shark, to monitor the temperature and other information about your graphics card.
What should I do if I encounter issues during the stress test?
If you experience anomalies, artifacts, or crashes during the test, it could indicate a faulty GPU or power supply. Consider swapping out the graphics card or power supply and rerun the tests.
Final Words
In a world that’s increasingly reliant on graphical computation for everything from gaming to scientific research, ensuring your GPU’s health is crucial. We’ve covered various approaches, from software solutions to physical inspections, benchmark tests, and even professional help. Your graphics card is a valuable asset; treat it as such by regularly monitoring its health.