Market research is useful only when it changes what a business does. A folder full of survey results, competitor screenshots and industry reports has little value if nobody can connect the findings to pricing, product development, marketing or expansion plans.
The real work begins after the information has been collected. Business owners need to decide which numbers deserve attention, which customer comments represent a real problem and which trends are interesting but irrelevant to the next decision.
A useful research process therefore moves from evidence to action. It starts with a clear business question, combines several types of data and ends with a decision that can be measured later.
Start With the Decision, Not With the Research
Market research becomes unfocused when a company starts collecting information without knowing what it wants to decide. “Learn more about our customers” is too vague. “Find out why customers abandon the checkout after adding a product” gives the research a clear job.
The same applies to larger decisions. A company considering a new market should examine demand, market size, pricing, customer location, competition and barriers to entry.
The U.S. Small Business Administration includes all of those areas in its market research and competitive analysis guidance.
A useful research question usually connects to a choice the company is already facing. Examples include deciding whether to raise prices, choosing between two customer groups, entering a new city, changing a product feature or increasing spending on a particular acquisition channel.
Research skills also improve with education and repeated practice. Learning how to compare sources, interpret statistics, structure an argument and explain what the numbers actually support is useful far outside a classroom.
Students working on business, economics or marketing assignments often develop the same habits, and academic support such as an essay writing service can provide reference material and structured examples for learning how research and evidence are organised.
Use More Than One Type of Evidence
No single research method gives a complete picture of a market. Sales data tells you what customers bought. Interviews can explain why they bought it. Competitor research shows the alternatives they had, and economic data helps place those choices inside a larger market.
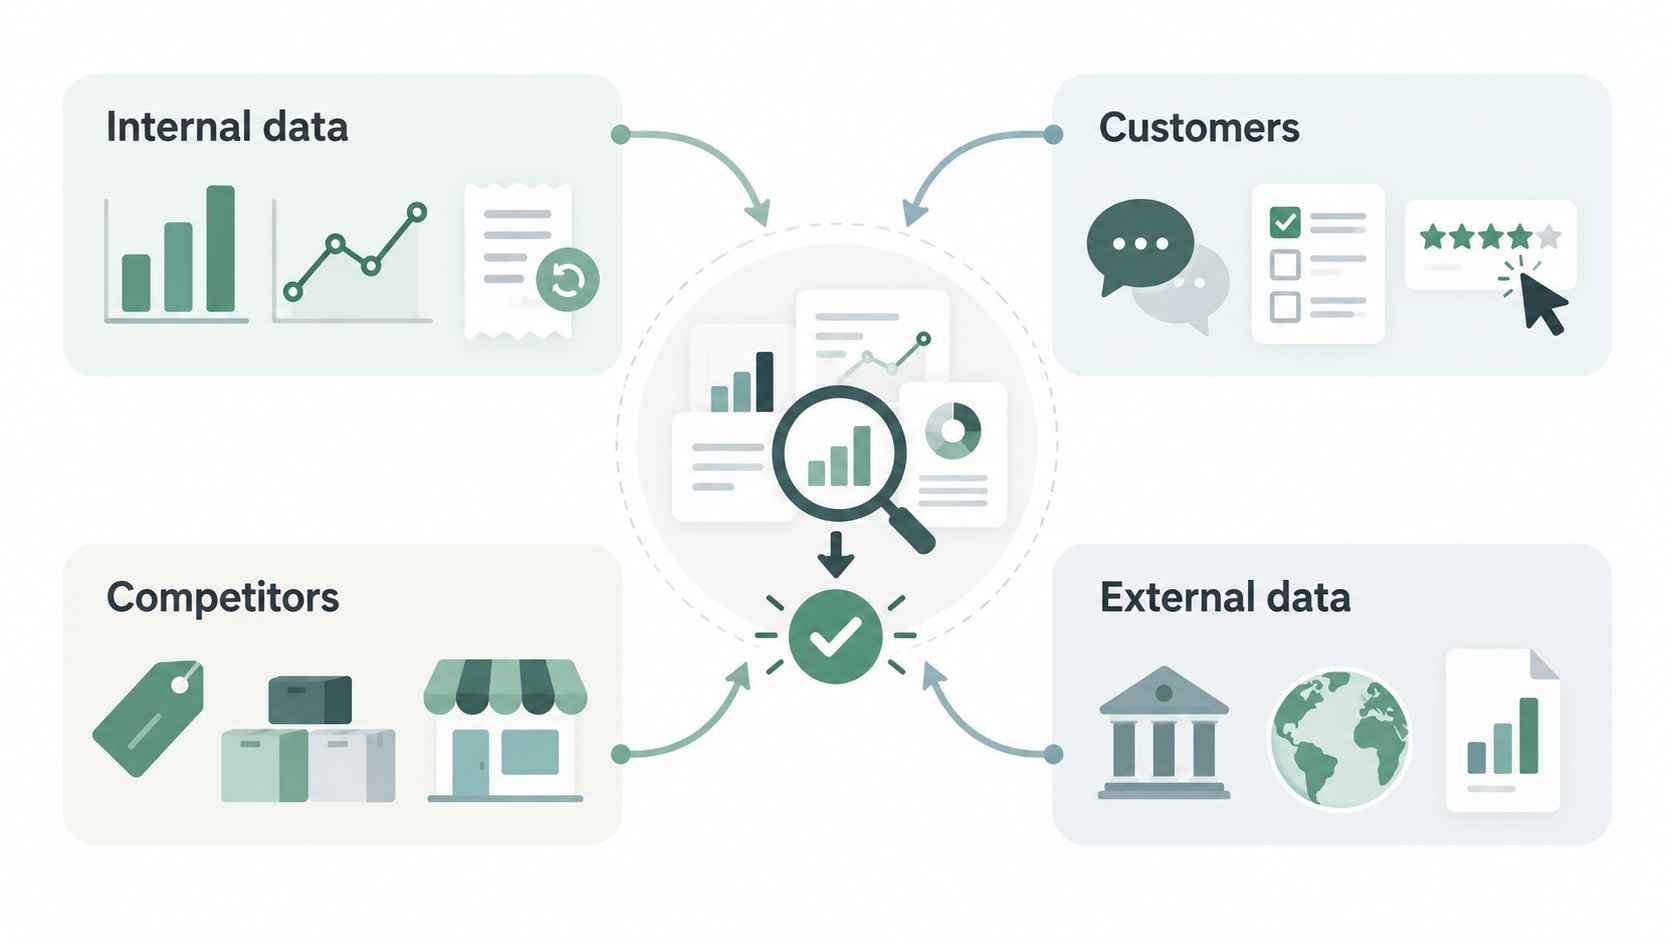
- Internal business data such as sales, returns, customer acquisition costs, retention and support requests.
- Customer research through interviews, surveys, reviews and usability testing.
- Competitor research covering pricing, positioning, product ranges and distribution.
- External data from government agencies, industry bodies and reliable research organisations.
The value comes from comparing them. A survey may suggest that customers want a cheaper product, but internal sales data might show that the higher-priced version already outsells the budget option. That disagreement deserves investigation before anybody changes the pricing strategy.
Separate Market Size From the Market You Can Actually Reach
Large market figures sound impressive in presentations, but they are often too broad to guide a real decision. A global industry worth billions does not tell a small business how many customers it can realistically acquire next year.
Start by narrowing the market according to geography, customer type, price range and distribution. A software company selling to independent dental practices needs data about dental practices that fit its product, not statistics for the entire healthcare technology industry.
Then consider how customers currently solve the problem. Some competitors will sell similar products, but others may compete indirectly. A project management platform may compete with another platform, spreadsheets, email and an internal process built by the customer.
The reachable market is usually much smaller than the headline industry figure, but it is also far more useful for planning sales targets and marketing budgets.
Read Customer Behaviour Before Customer Opinions

Customers can explain their preferences, frustrations and expectations, but behaviour often gives the clearest signal of what they value enough to pay for.
Look at purchases, repeat orders, cancellations, upgrades, refunds and abandoned carts. Compare those actions with what customers say in interviews or surveys.
A customer who says price is the main concern but repeatedly purchases the premium version is giving two different signals. The purchase behaviour deserves serious attention because money has already been committed.
The same principle applies to product features. A feature may receive enthusiastic feedback during interviews but very little real usage after launch. Another feature may sound boring in a survey yet appear in almost every successful customer workflow.
Turn Competitor Research Into Specific Questions
Competitor research becomes weak when it turns into a collection of website screenshots and feature lists. The useful question is not simply what competitors offer. It is what their choices reveal about the market.
Compare pricing structures, customer segments, product depth, guarantees, sales channels and review themes. Look for areas where competitors cluster around the same approach and areas where their strategies differ.
Customer reviews can be particularly informative. Repeated complaints about setup, delivery, support or hidden costs may point toward a problem that competitors have not handled well.
Do not assume that every gap represents an opportunity. A feature missing from several competitors may be absent because customers do not value it enough to justify the cost.
Use Statistics to Narrow Decisions, Not to Decorate Reports

Statistics are useful when they change the probability of one decision being better than another. They become useless when they are added to a report only because the number sounds impressive.
Every figure needs context. A growth rate should include the period being measured. A customer percentage should identify the group surveyed. A market estimate should explain the geography and category it covers.
Government datasets can provide useful background. The U.S. Census Bureau, for example, publishes business data through programmes including the Annual Business Survey, which covers economic and demographic characteristics of employer businesses as well as topics such as innovation and technology.
Numbers should also be compared with internal data whenever possible.
National consumer spending may be rising, but that does not automatically mean demand for one company is increasing. Local sales, search demand, conversion rates and customer behaviour still need to support the decision.
Look for Differences Between Customer Segments
Averages can hide the most useful information in a dataset. Two customer groups may behave so differently that combining them produces a result that describes neither group accurately.
Break the research down by characteristics that affect the decision. Depending on the business, that could include company size, location, purchase frequency, age, account value or acquisition source.
Imagine that average customer retention appears stable. A closer look might show that small customers are leaving quickly while larger accounts are staying longer than before. The average hides a serious problem in one segment and an improvement in another.
Segmentation also helps marketing teams avoid spending equally across audiences with very different economics. The largest group is not always the most profitable one.
Translate Research Into a Small Number of Options

Research should reduce uncertainty, not produce an endless list of possible strategies. Once the evidence has been reviewed, turn it into two or three realistic choices.
A company studying a new geographic market might end with options such as launching immediately, running a limited pilot or postponing entry until a specific condition changes.
- Expected demand
- Potential margin
- Cash required
- Time before useful results appear
- Operational difficulty
- Risk if the decision is wrong
A decision becomes easier to discuss when managers are comparing defined options instead of interpreting dozens of unrelated research findings.
Test Important Assumptions Before Making a Large Commitment
Market research reduces uncertainty, but it does not eliminate it. Customers behave differently when money, time and real products are involved.
Small experiments can test the assumptions behind a larger decision. A retailer considering a new city might start with a temporary location or targeted online campaign. A software company can test a new package with a small customer group before changing pricing for everyone.
The experiment should connect directly to the uncertain part of the decision. If the main question is price sensitivity, test pricing. If the uncertainty concerns demand, measure real enquiries, purchases or deposits rather than social media engagement alone.
Reversible experiments are especially useful when the evidence is mixed. They give the company new information without requiring a large commitment before demand has been demonstrated.
Know When the Research Is Too Weak to Support the Decision

Not every research project produces a useful answer. Small samples, biased surveys, outdated reports or poor customer data can create false confidence.
Check how the information was collected before relying on it. A survey answered mainly by existing loyal customers will say little about people who considered the product and bought from a competitor instead.
Old industry reports can also become misleading in markets where prices, regulation, technology or customer behaviour change quickly.
When the evidence is weak, the correct response is not to make the report sound more certain. Narrow the decision, collect another source of evidence or choose an option that limits the cost of being wrong.
Connect Every Finding to a Business Metric
A research finding becomes much easier to use when the company knows what should change if the conclusion is correct.
If research suggests that customers abandon purchases because delivery costs appear too late, the relevant metrics might include checkout completion and order value after the fee presentation changes.
If interviews indicate that onboarding is too complicated, measure activation time, support requests and early churn after simplifying the process.
The metric gives the research a second life. Instead of ending when the report is delivered, the original conclusion can be tested against what actually happens after the company acts.
Keep a Record of What the Business Expected to Happen
Decision quality is difficult to improve when companies remember only the final outcome. A successful launch can make weak research look smarter than it was, and a failed launch can make a reasonable decision look foolish in hindsight.
Write down the evidence, assumptions and expected result before acting. Record what would cause the company to change direction as well.
Six months later, compare the prediction with the real outcome. Perhaps the market grew as expected but customer acquisition costs were much higher. Maybe demand existed, but the sales cycle took twice as long as planned.
Those differences improve the next research project because the company can see where its earlier assumptions failed.
Market Research Should End With an Action
A research report is not the finished product. The finished product is a decision that has stronger evidence behind it than the company had before the research started.
That decision may be to launch, wait, change the price, focus on another customer segment or stop pursuing an idea entirely. Finding evidence against a plan is still useful if it prevents months of spending on the wrong opportunity.
The strongest research process stays close to the decision from beginning to end. Ask a specific question, collect evidence from several sources, examine the numbers in context, compare realistic options and measure what happens after the company acts.